Qualcomm Inc.
Analyst Listing
The following analysts provide coverage for the subject firm as of May 2016:
| Broker | Analyst | Analyst Email |
| RBC Capital Markets | Amit Daryanani | amit.daryanani@rbccm.com |
| William Blair | Anil Doradla | adoradla@williamblair.com |
| Evercore ISI | C.J. Muse | cj.muse@evercoreisi.com |
| Atlantic Equities | James Cordwell | j.cordwell@atlantic-equities.com |
| Stifel Nicolaus | Kevin E Cassidy | kcassidy@stifel.com |
| Credit Suisse | Kulbinder Garcha | kulbinder.garcha@credit-suisse.com |
| Pacific Crest Securities-KBCM | Michael McConnell | mmcconnell@pacific-crest.com |
| Brean Capital, LLC | Mike Burton | mburton@breancapital.com |
| Oppenheimer | Rick Schafer | rick.schafer@opco.com |
| Nomura Research | Romit Shah | romit.shah@nomura.com |
| Bernstein Research | Stacy A Rasgon | stacy.rasgon@bernstein.com |
| Topeka Capital Markets | Suji De Silva | sd@topekacapitalmarkets.com |
| Canaccord Genuity | T. Michael Walkley | mwalkley@canaccordgenuity.com |
| Raymond James | Tavis C. McCourt | tavis.mccourt@raymondjames.com |
| Northland Securities | Thomas Sepenzis | tsepenzis@northlandcapitalmarkets.com |
| BMO Capital Markets | Tim Long | tim.long@bmo.com |
| Cowen & Company | Timothy Arcuri | timothy.arcuri@cowen.com |
| Mizuho Securities USA | Vijay Rakesh | vijay.rakesh@us.mizuho-sc.com |
| Daiwa Securities Co. Ltd. | Yoko Yamada | yoko.yamada@us.daiwacm.com |
Primary Input Data
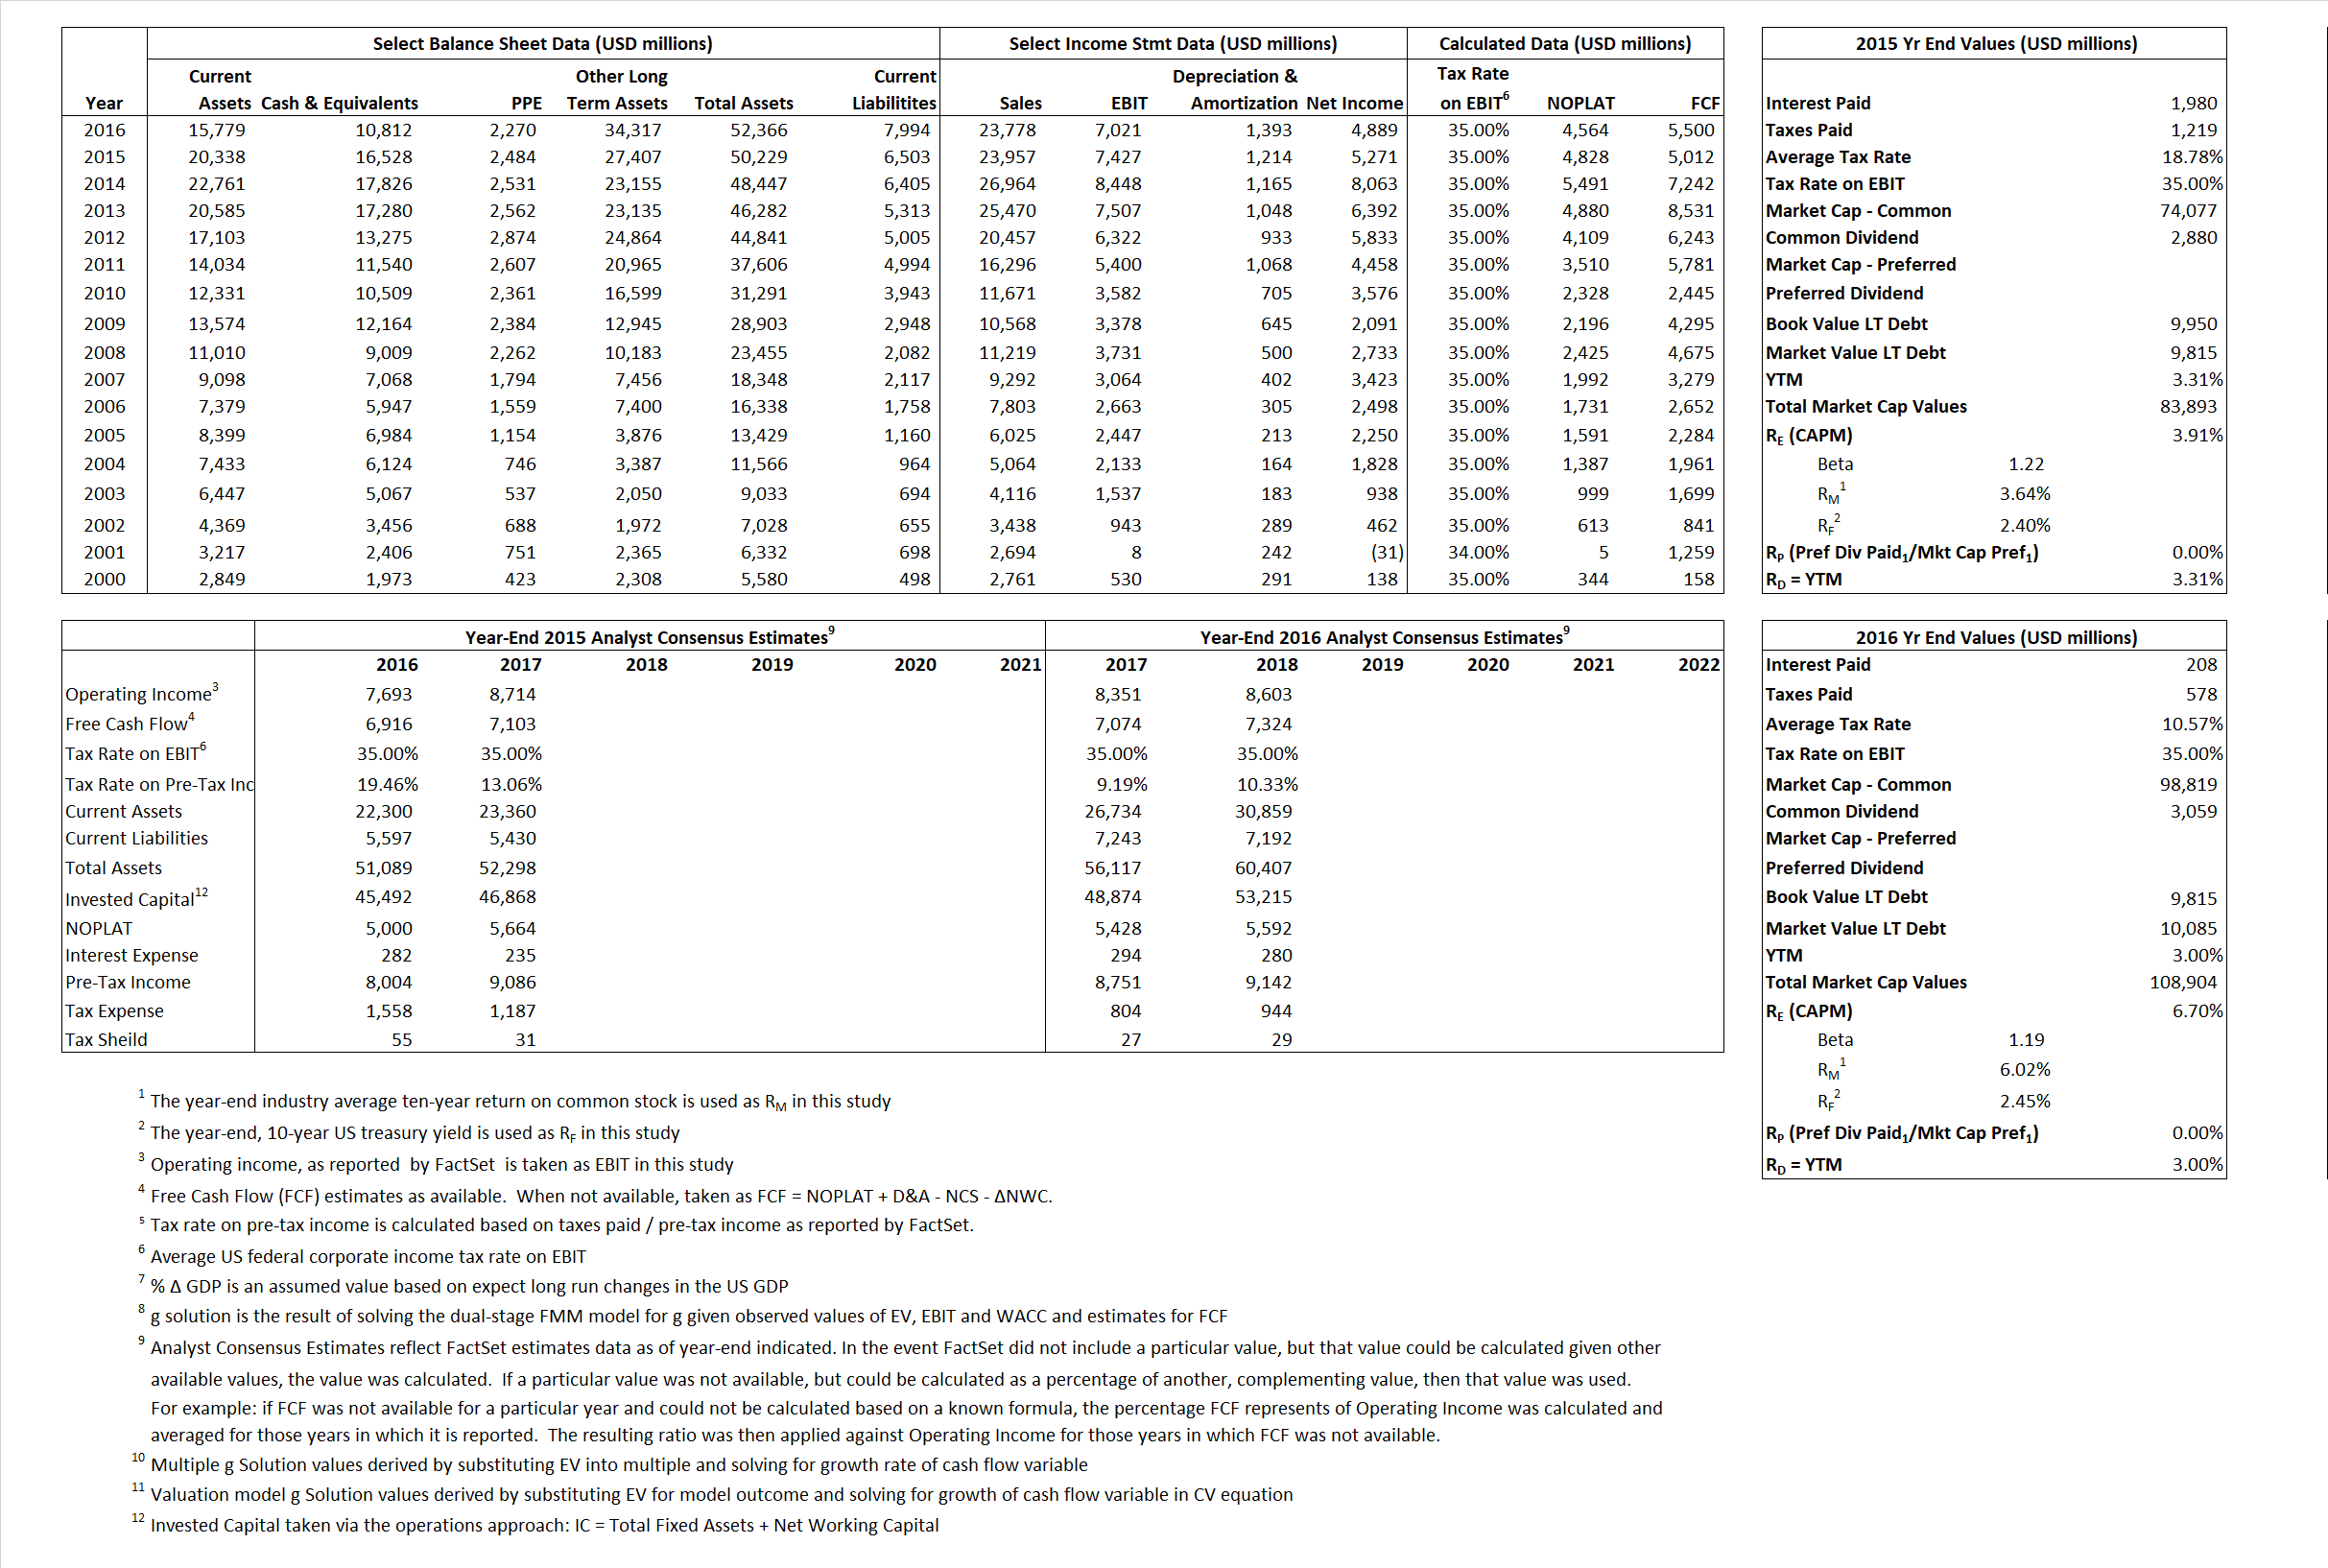
Derived Input Data
Derived Input |
Label |
2015 Value |
2016
|
Equational Form |
| Net Operating Profit Less Adjusted Taxes | NOPLAT | 4,828 | 4,564 |  |
| Free Cash Flow | FCF | 5,012 | 5,500 |  |
| Tax Shield | TS | 372 | 22 |  |
| Invested Capital | IC | 43,726 | 44,372 |  |
| Return on Invested Capital | ROIC | 11.04% | 10.28% |  |
| Net Investment | NetInv | 2,898 | 2,039 |  |
| Investment Rate | IR | 60.03% | 44.68% |  |
| Weighted Average Cost of Capital |
WACCMarket | 3.77% | 6.33% |  |
| WACCBook | 9.60% | 9.34% | ||
| Enterprise value |
EVMarket | 67,365 | 98,092 |  |
| EVBook | 73,215 | 97,822 | ||
| Long-Run Growth |
g = IR x ROIC |
6.63% | 4.60% | Long-run growth rates of the income variable are used in the Continuing Value portion of the valuation models. |
g = %  GDP GDP |
2.50% | 2.50% | ||
| Margin from Operations | M | 31.00% | 29.53% |  |
| Depreciation/Amortization Rate | D | 14.05% | 16.56% |  |
Valuation Multiple Outcomes
The outcomes presented in this study are the result of original input data, derived data, and synthesized inputs.
Equational Form |
Observed Value |
Single-stagemultiple g solution |
Two-stage valuationmodel g solution |
|||
| 12/31/2015 | 12/31/2016 | 12/31/2015 | 12/31/2016 | 12/31/2015 | 12/31/2016 | |
|
|
2.81 | 4.13 | -9.68% | 3.06% | -18.11% | 3.69% |
|
|
7.80 | 11.66 | -9.68% | 3.06% | -18.11% | 3.69% |
|
|
13.95 | 21.49 | -9.68% | 3.06% | -18.11% | 3.69% |
|
|
13.44 | 17.83 | -9.68% | 3.06% | -18.11% | 3.69% |
|
|
9.07 | 13.97 | -9.68% | 3.06% | -18.11% | 3.69% |
|
|
1.54 | 2.21 | -9.68% | 3.06% | -18.11% | 3.69% |


