Altria Group, Inc.
Analyst Listing
The following analysts provide coverage for the subject firm as of May 2016:
| Broker | Analyst | Analyst Email |
| Wells Fargo Securities | Bonnie Herzog | bonnie.herzog@wellsfargo.com |
| Stifel Nicolaus | Christopher R. Growe | growec@stifel.com |
| RBC Capital Markets | Nik Modi | nik.modi@rbccm.com |
| Cowen & Company | Vivien Azer | vivien.azer@cowen.com |
Primary Input Data
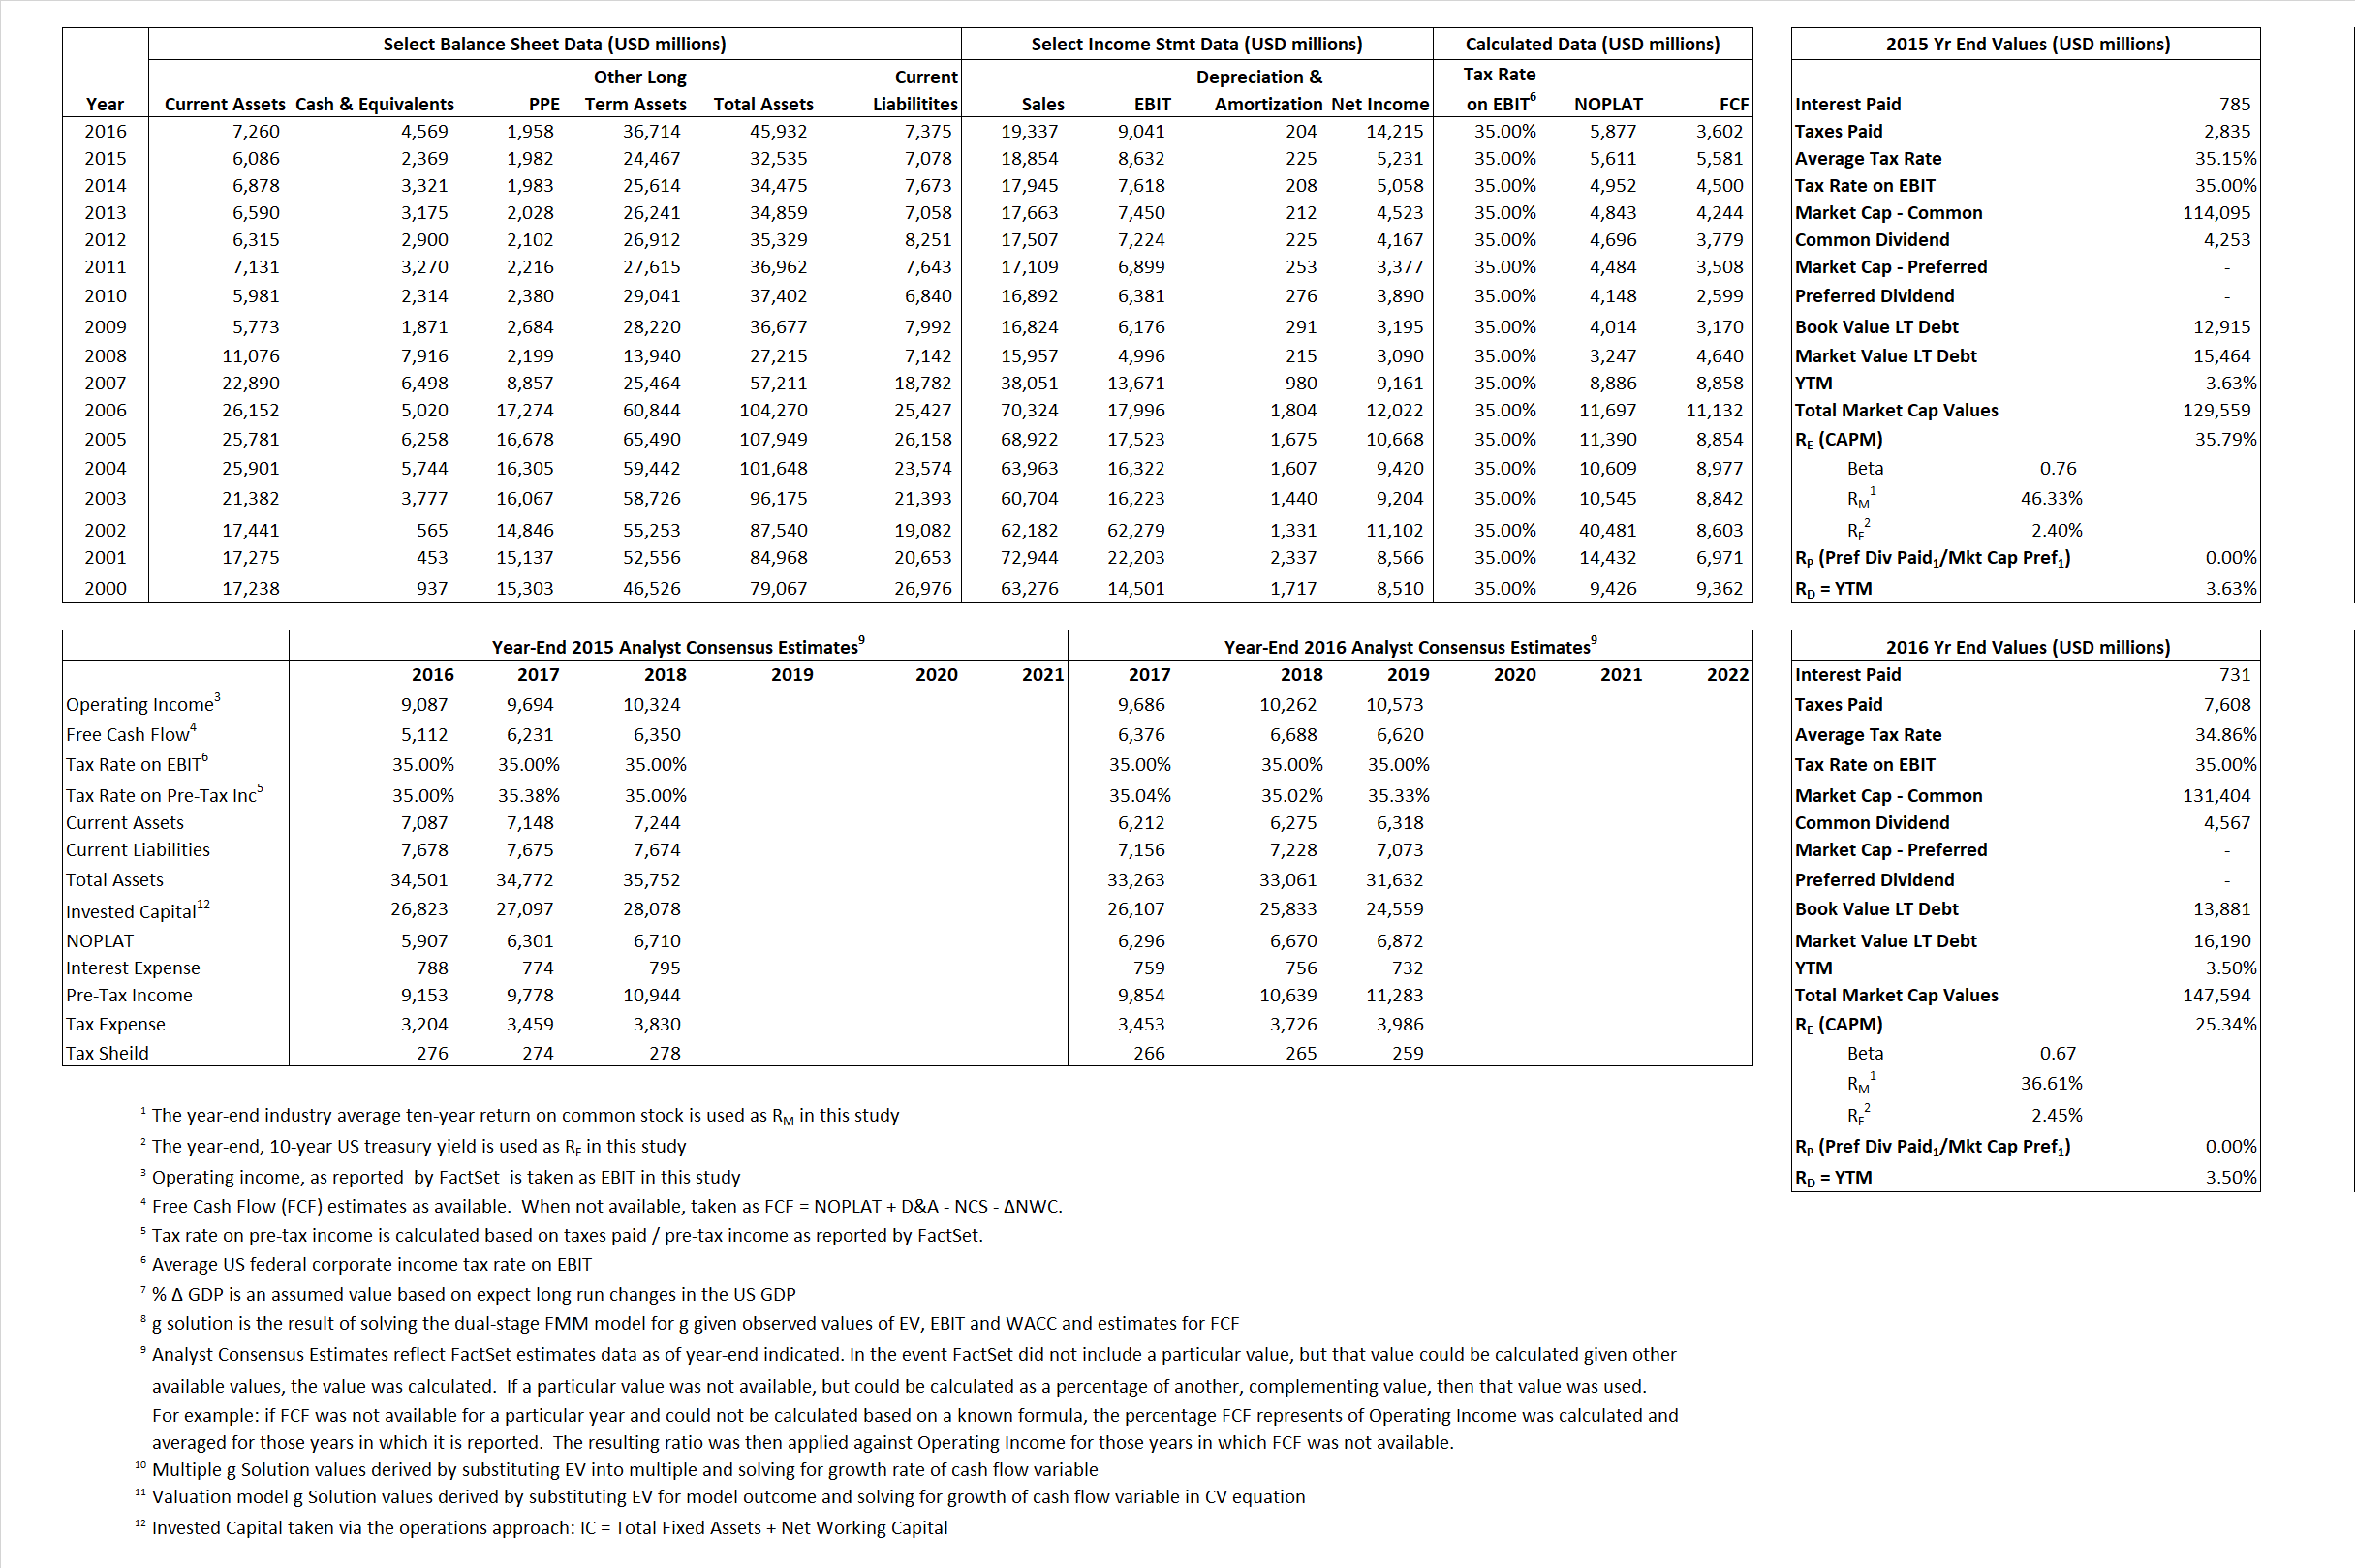
Derived Input Data
Derived Input |
Label |
2015 Value |
2016
|
Equational Form |
| Net Operating Profit Less Adjusted Taxes | NOPLAT | 5,611 | 5,877 |  |
| Free Cash Flow | FCF | 5,581 | 3,602 |  |
| Tax Shield | TS | 276 | 255 |  |
| Invested Capital | IC | 25,457 | 38,557 |  |
| Return on Invested Capital | ROIC | 22.04% | 15.24% |  |
| Net Investment | NetInv | (1,120) | 13,304 |  |
| Investment Rate | IR | -19.96% | 226.39% |  |
| Weighted Average Cost of Capital |
WACCMarket | 31.80% | 22.81% |  |
| WACCBook | 7.12% | 6.39% | ||
| Enterprise value |
EVMarket | 127,190 | 143,025 |  |
| EVBook | 122,441 | 140,716 | ||
| Long-Run Growth |
g = IR x ROIC |
-4.40% | 34.50% | Long-run growth rates of the income variable are used in the Continuing Value portion of the valuation models. |
g = %  GDP GDP |
2.50% | 2.50% | ||
| Margin from Operations | M | 45.78% | 46.75% |  |
| Depreciation/Amortization Rate | D | 2.54% | 2.21% |  |
Valuation Multiple Outcomes
The outcomes presented in this study are the result of original input data, derived data, and synthesized inputs.
Equational Form |
Observed Value |
Single-stagemultiple g solution |
Two-stage valuationmodel g solution |
|||
| 12/31/2015 | 12/31/2016 | 12/31/2015 | 12/31/2016 | 12/31/2015 | 12/31/2016 | |
|
|
6.75 | 7.40 | 34.24% | 25.60% | 32.82% | 24.10% |
|
|
14.36 | 15.47 | 34.24% | 25.60% | 32.82% | 24.10% |
|
|
22.67 | 24.34 | 34.24% | 25.60% | 32.82% | 24.10% |
|
|
22.79 | 39.71 | 34.24% | 25.60% | 32.82% | 24.10% |
|
|
14.73 | 15.82 | 34.24% | 25.60% | 32.82% | 24.10% |
|
|
5.00 | 3.71 | 34.24% | 25.60% | 32.82% | 24.10% |


