Colgate-Palmolive Company
Analyst Listing
The following analysts provide coverage for the subject firm as of May 2016:
| Broker | Analyst | Analyst Email |
| Bernstein Research | Ali Dibadj | ali.dibadj@bernstein.com |
| CRT Capital Group | April Scee | ascee@sterneageecrt.com |
| Deutsche Bank Research | Bill Schmitz Jr. | william.schmitz@db.com |
| Atlantic Equities | Charles Eden | c.eden@atlantic-equities.com |
| Consumer Edge Research | Javier Escalante | jescalante@consumeredgeresearch.com |
| William Blair | Jon R. Andersen | jandersen@williamblair.com |
| Raymond James | Joseph Altobello | joe.altobello@raymondjames.com |
| First Global Stockbroking | Kavita Thomas | kavita.thomas@fglobal.com |
| B Riley & Co | Linda Bolton Weiser | lweiser@brileyco.com |
| Stifel Nicolaus | Mark S. Astrachan | msastrachan@stifel.com |
| RBC Capital Markets | Nik Modi | nik.modi@rbccm.com |
| SunTrust Robinson Humphrey | William B. Chappell Jr. | bill.chappell@suntrust.com |
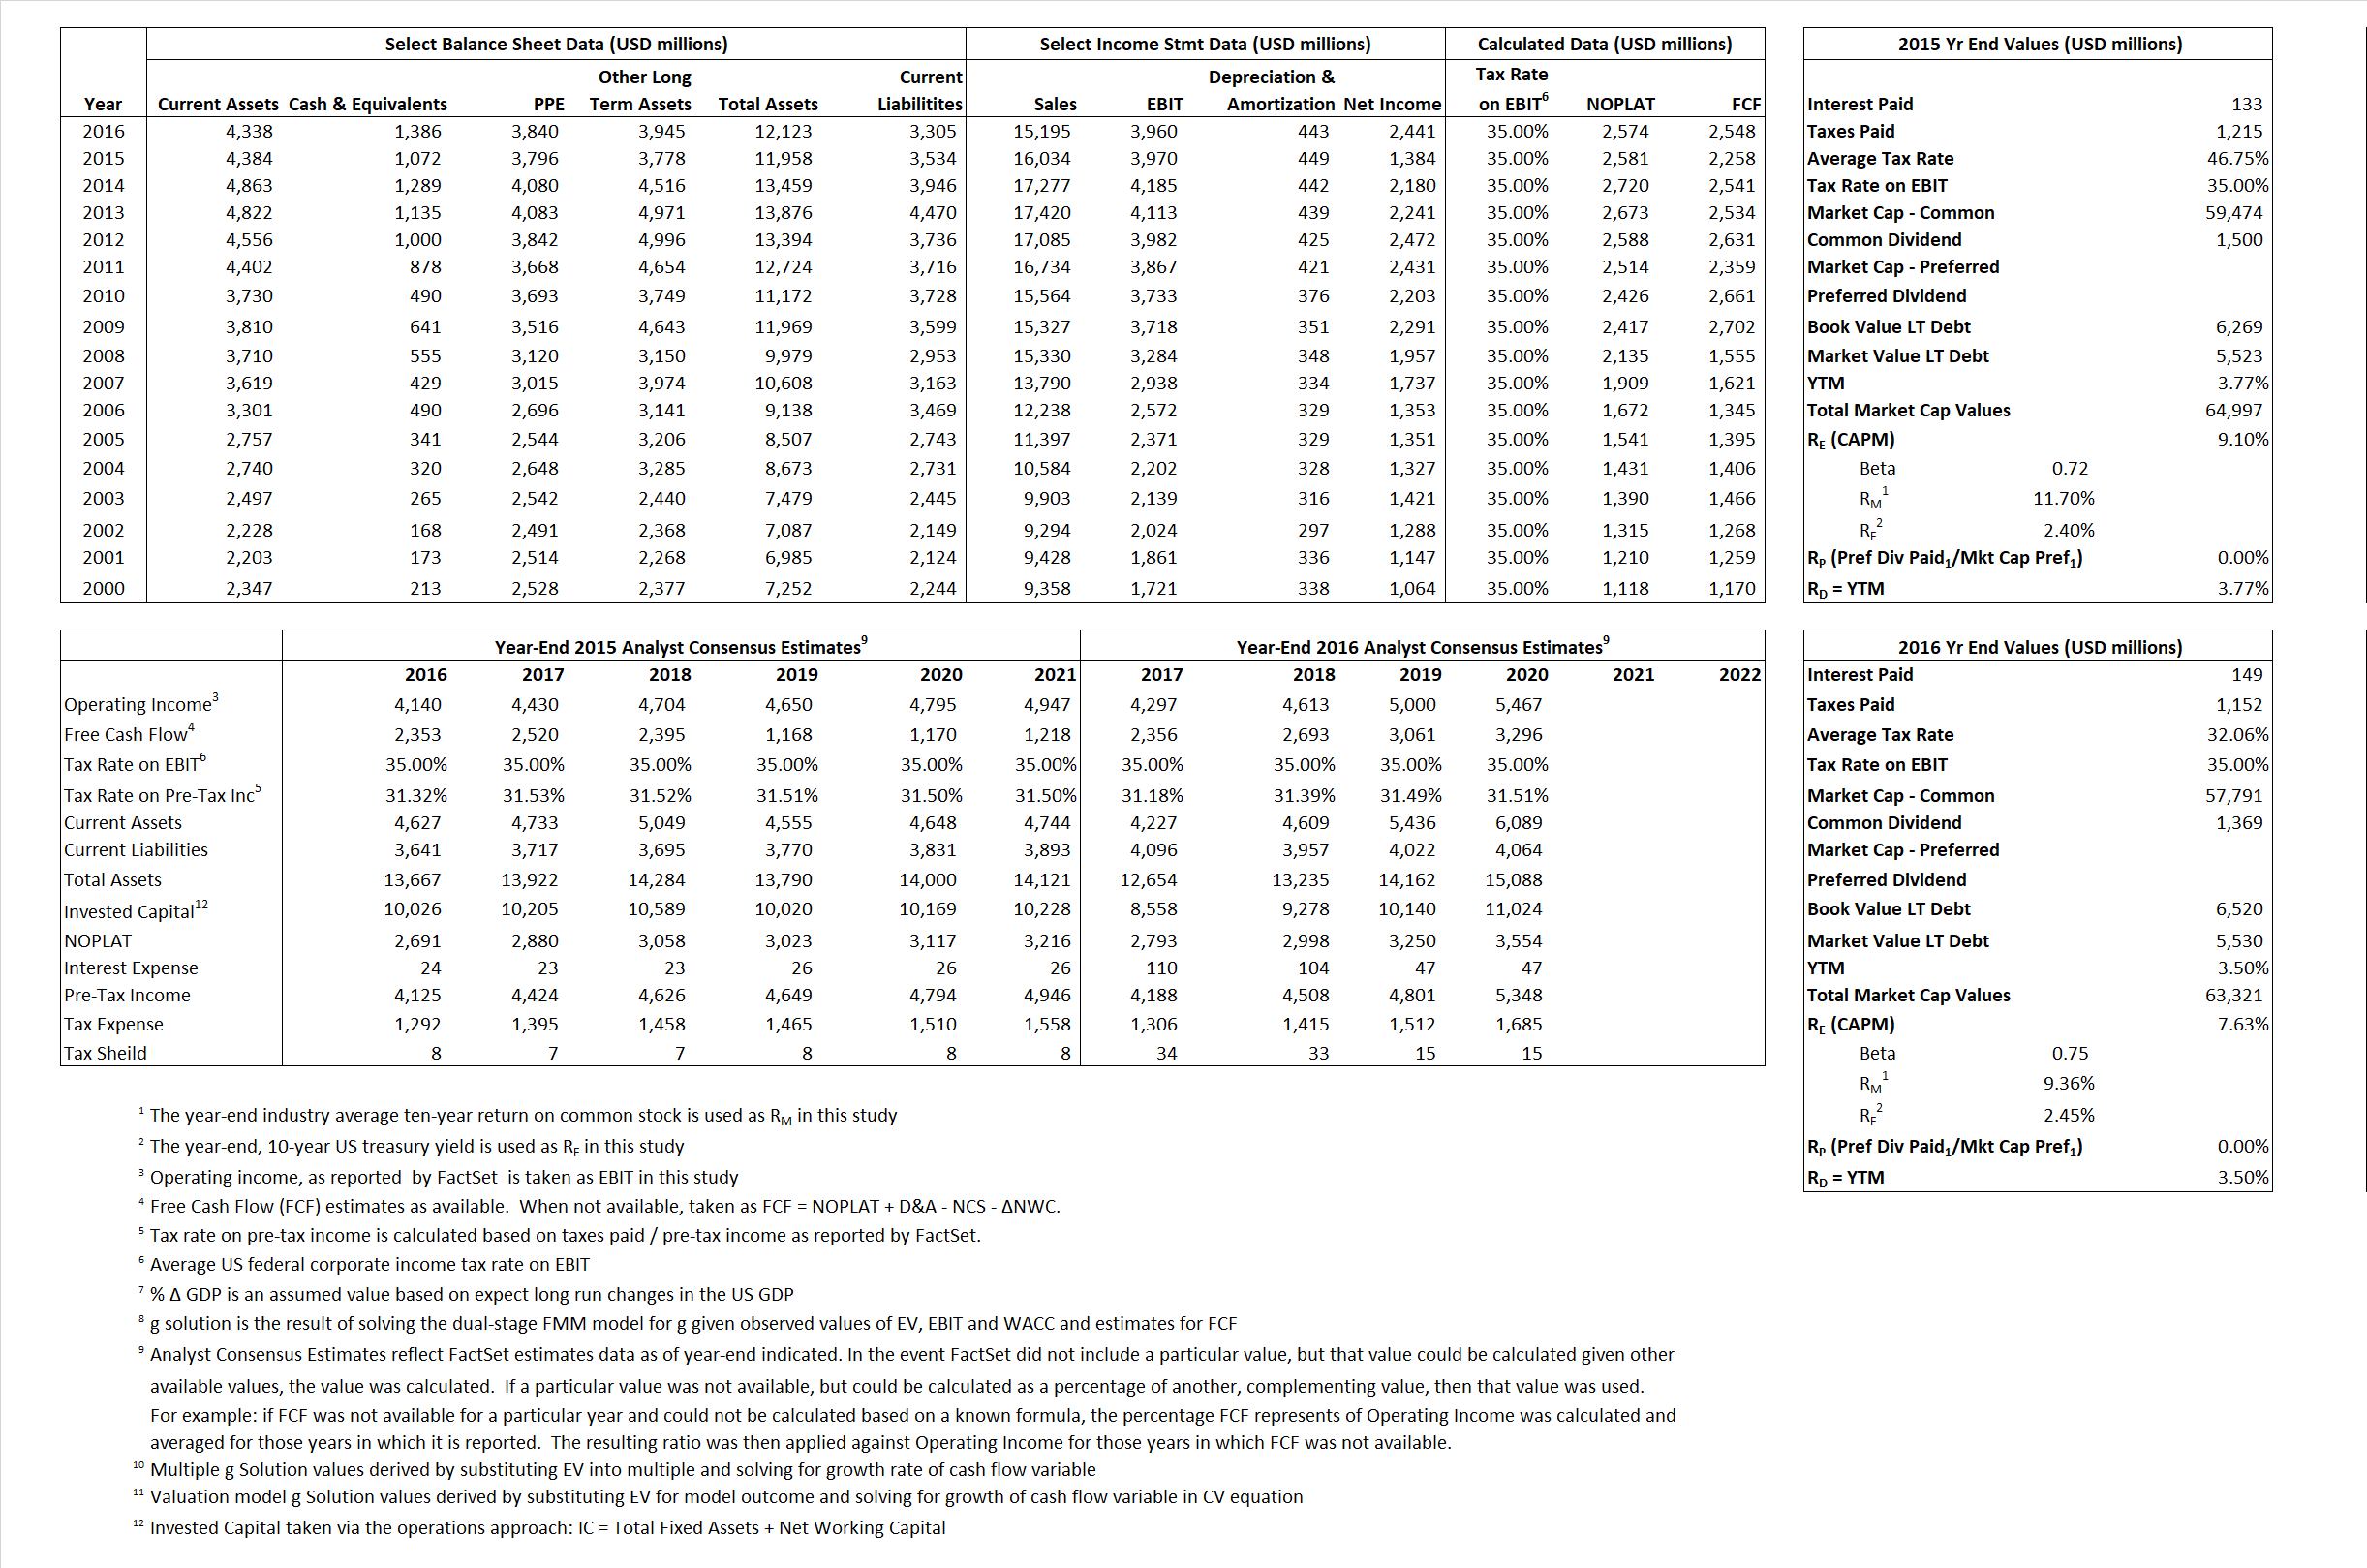
Primary Input Data
Derived Input Data
Derived Input |
Label |
2015 Value |
2016
|
Equational Form |
| Net Operating Profit Less Adjusted Taxes | NOPLAT | 2,581 | 2,574 |  |
| Free Cash Flow | FCF | 2,258 | 2,548 |  |
| Tax Shield | TS | 62 | 48 |  |
| Invested Capital | IC | 8,424 | 8,818 |  |
| Return on Invested Capital | ROIC | 30.63% | 29.19% |  |
| Net Investment | NetInv | (640) | 837 |  |
| Investment Rate | IR | -24.80% | 32.52% |  |
| Weighted Average Cost of Capital |
WACCMarket | 8.49% | 7.17% |  |
| WACCBook | 6.85% | 6.82% | ||
| Enterprise value |
EVMarket | 63,925 | 61,935 |  |
| EVBook | 64,671 | 62,925 | ||
| Long-Run Growth |
g = IR x ROIC |
-7.60% | 9.49% | Long-run growth rates of the income variable are used in the Continuing Value portion of the valuation models. |
g = %  GDP GDP |
2.50% | 2.50% | ||
| Margin from Operations | M | 24.76% | 26.06% |  |
| Depreciation/Amortization Rate | D | 10.16% | 10.06% |  |
Valuation Multiple Outcomes
The outcomes presented in this study are the result of original input data, derived data, and synthesized inputs.
Equational Form |
Observed Value |
Single-stagemultiple g solution |
Two-stage valuationmodel g solution |
|||
| 12/31/2015 | 12/31/2016 | 12/31/2015 | 12/31/2016 | 12/31/2015 | 12/31/2016 | |
|
|
3.99 | 4.08 | 5.13% | 3.52% | 6.04% | 4.51% |
|
|
14.47 | 14.07 | 5.13% | 3.52% | 6.04% | 4.51% |
|
|
24.77 | 24.03 | 5.13% | 3.52% | 6.04% | 4.51% |
|
|
28.31 | 24.31 | 5.13% | 3.52% | 6.04% | 4.51% |
|
|
16.10 | 15.64 | 5.13% | 3.52% | 6.04% | 4.51% |
|
|
7.59 | 7.02 | 5.13% | 3.52% | 6.04% | 4.51% |


