Eli Lilly and Company
Analyst Listing
The following analysts provide coverage for the subject firm as of May 2016:
| Broker | Analyst | Analyst Email |
| BMO Capital Markets | Alex Arfaei | alex.arfaei@bmo.com |
| Deutsche Bank Research | Gregg Gilbert | gregg.gilbert@db.com |
| SunTrust Robinson Humphrey | John T. Boris | john.t.boris@suntrust.com |
| Piper Jaffray | Richard J. Purkiss | richard.j.purkiss@pjc.com |
| Leerink Partners | Seamus Fernandez | seamus.fernandez@leerink.com |
| Atlantic Equities | Steve Chesney | s.chesney@atlantic-equities.com |
| Cowen & Company | Steve Scala | steve.scala@cowen.com |
| Bernstein Research | Tim Anderson | tim.anderson@bernstein.com |
| Guggenheim Securities | Tony Butler | tony.butler@guggenheimpartners.com |
| Credit Suisse | Vamil Divan | vamil.divan@credit-suisse.com |
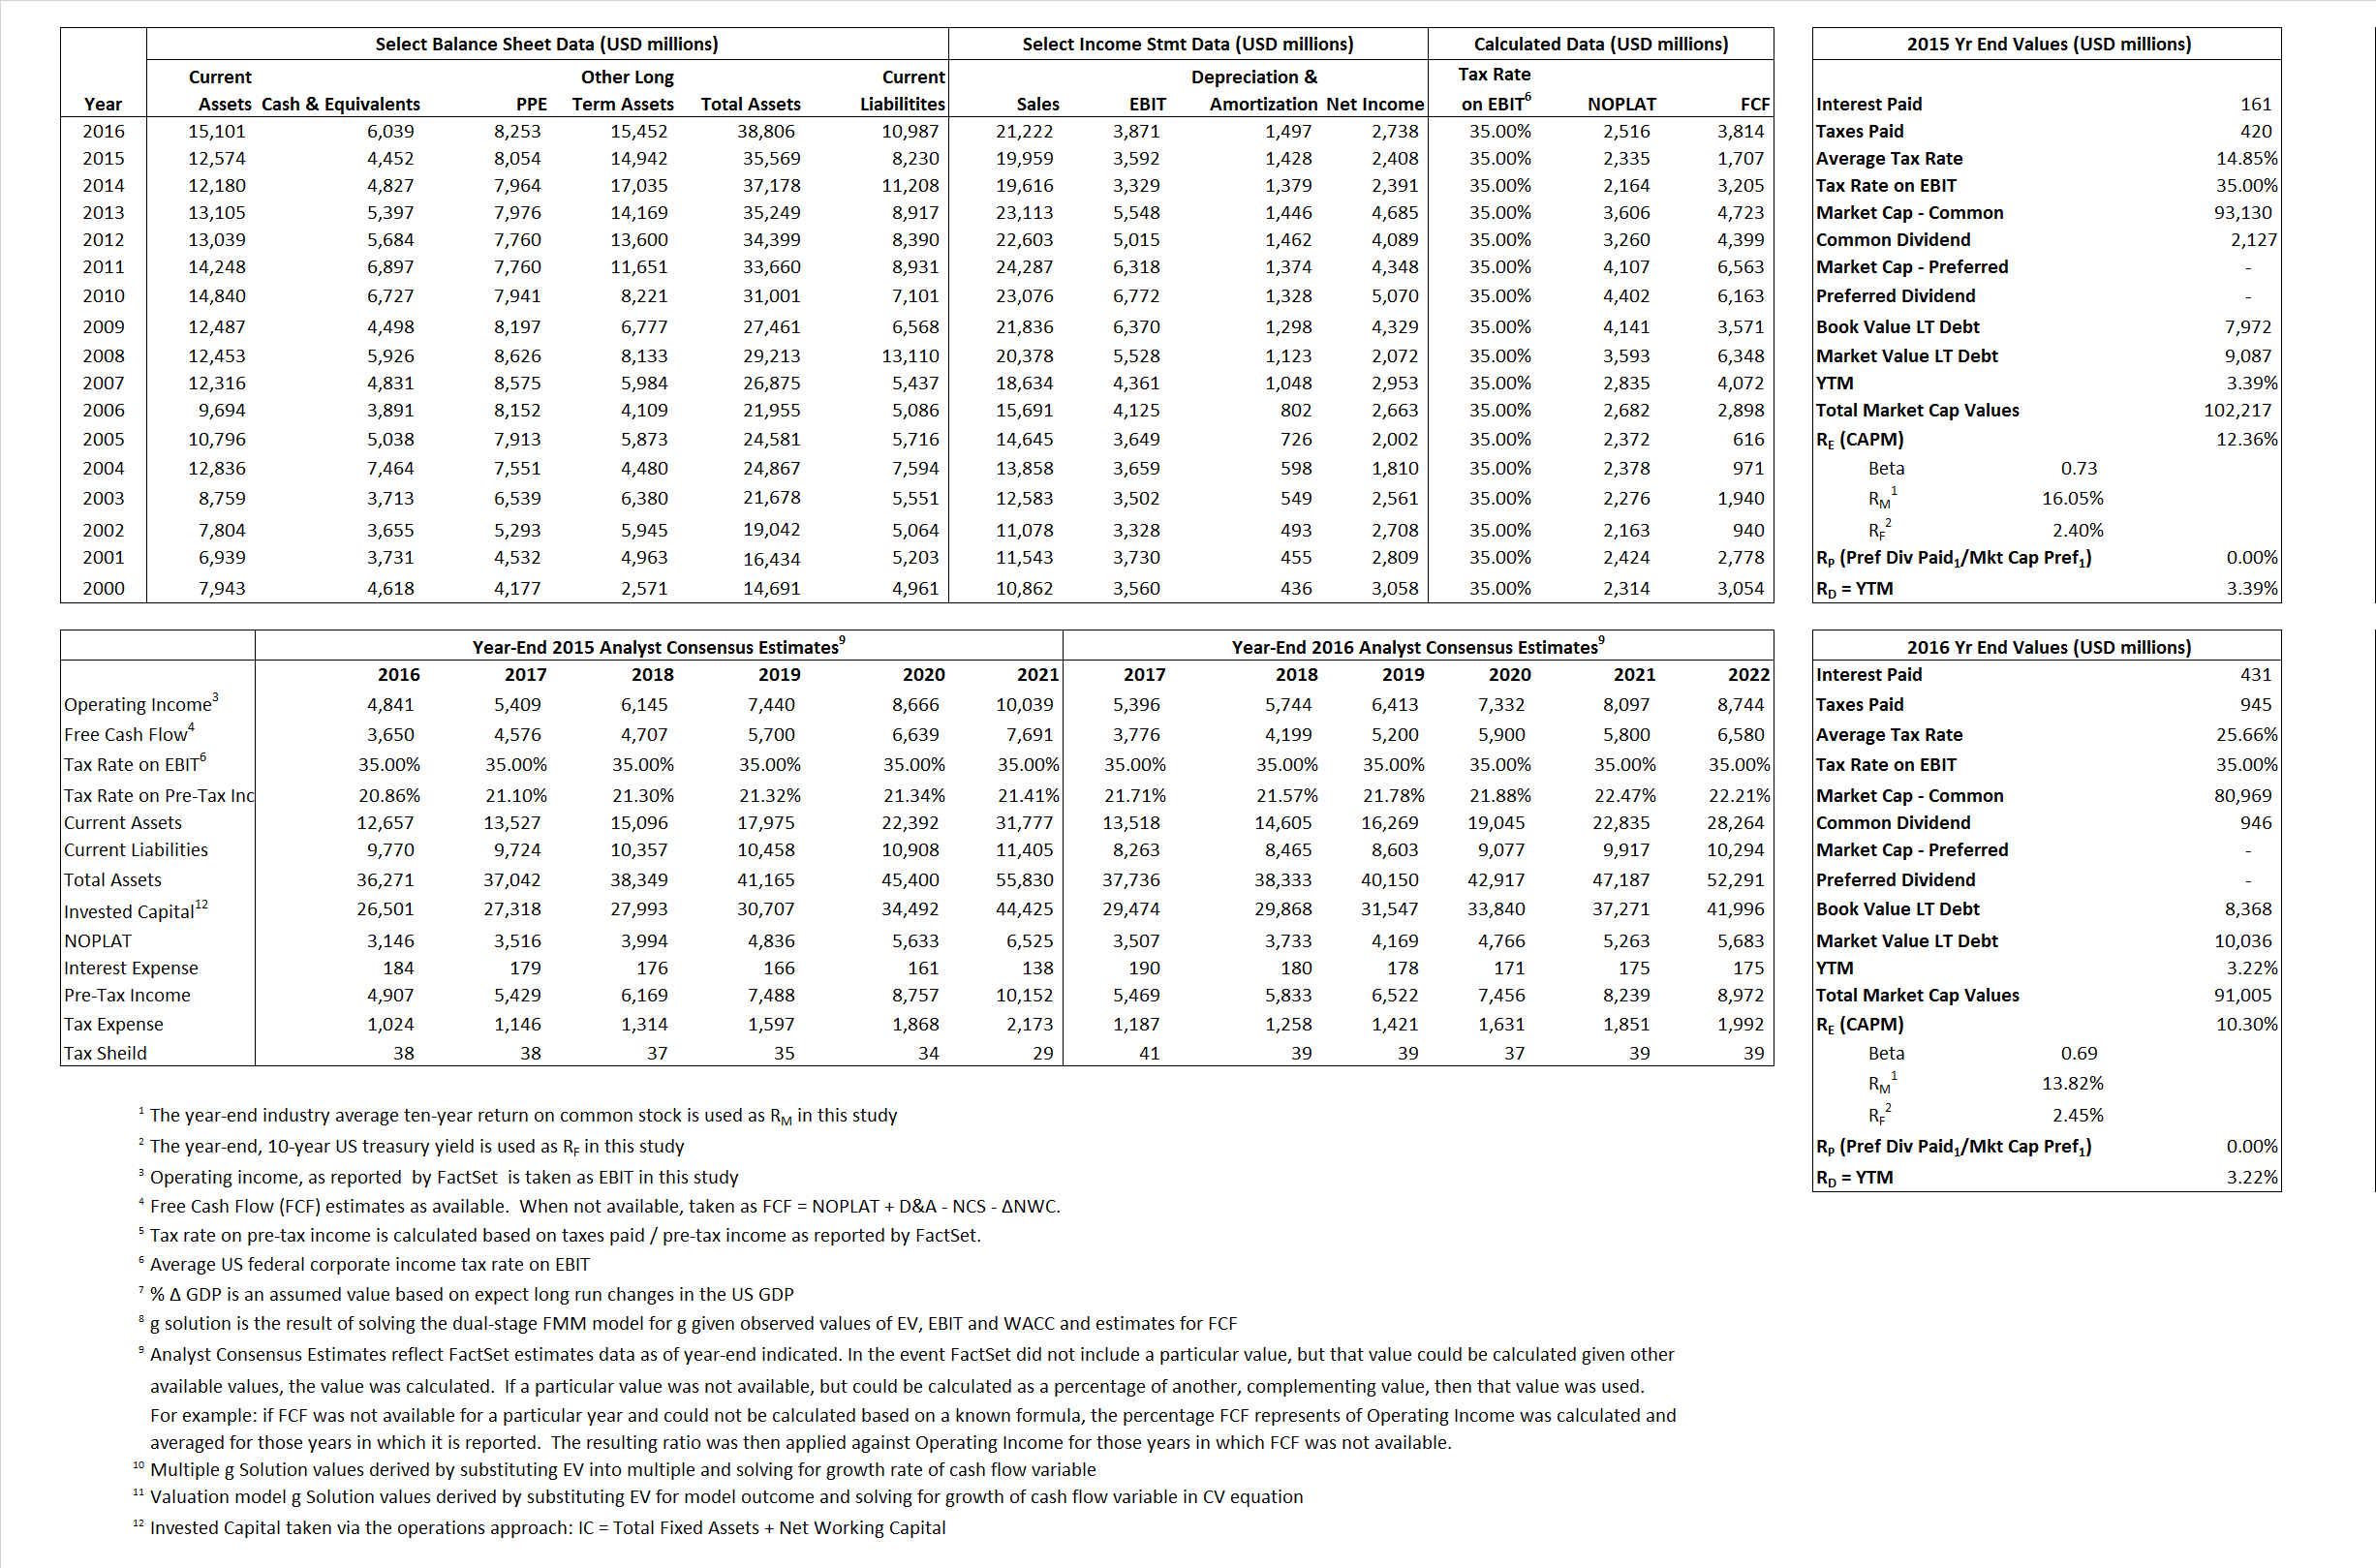
Primary Input Data
Derived Input Data
Derived Input |
Label |
2015 Value |
2016
|
Equational Form |
| Net Operating Profit Less Adjusted Taxes | NOPLAT | 2,335 | 2,516 |  |
| Free Cash Flow | FCF | 1,707 | 3,814 |  |
| Tax Shield | TS | 24 | 111 |  |
| Invested Capital | IC | 27,339 | 27,819 |  |
| Return on Invested Capital | ROIC | 8.54% | 9.04% |  |
| Net Investment | NetInv | 2,796 | 1,977 |  |
| Investment Rate | IR | 119.76% | 78.56% |  |
| Weighted Average Cost of Capital |
WACCMarket | 11.52% | 9.42% |  |
| WACCBook | 7.10% | 6.39% | ||
| Enterprise value |
EVMarket | 97,765 | 84,966 |  |
| EVBook | 95,063 | 83,298 | ||
| Long-Run Growth |
g = IR x ROIC |
10.23% | 7.11% | Long-run growth rates of the income variable are used in the Continuing Value portion of the valuation models. |
g = %  GDP GDP |
2.50% | 2.50% | ||
| Margin from Operations | M | 18.00% | 18.24% |  |
| Depreciation/Amortization Rate | D | 28.44% | 27.89% |  |
Valuation Multiple Outcomes
The outcomes presented in this study are the result of original input data, derived data, and synthesized inputs.
Equational Form |
Observed Value |
Single-stagemultiple g solution |
Two-stage valuationmodel g solution |
|||
| 12/31/2015 | 12/31/2016 | 12/31/2015 | 12/31/2016 | 12/31/2015 | 12/31/2016 | |
|
|
4.90 | 4.00 | 12.68% | 9.61% | 12.26% | 9.52% |
|
|
19.48 | 15.83 | 12.68% | 9.61% | 12.26% | 9.52% |
|
|
41.87 | 33.77 | 12.68% | 9.61% | 12.26% | 9.52% |
|
|
57.29 | 22.28 | 12.68% | 9.61% | 12.26% | 9.52% |
|
|
27.22 | 21.95 | 12.68% | 9.61% | 12.26% | 9.52% |
|
|
3.58 | 3.05 | 12.68% | 9.61% | 12.26% | 9.52% |


