Gilead Sciences Inc.
Analyst Listing
The following analysts provide coverage for the subject firm as of May 2016:
| Broker | Analyst | Analyst Email |
| Jefferies | Brian Abrahams | babrahams@jefferies.com |
| Piper Jaffray | Joshua Schimmer | joshua.e.schimmer@pjc.com |
| RBC Capital Markets | Michael J. Yee | michael.yee@rbccm.com |
| Leerink Partners | Geoffrey C. Porges | geoffrey.porges@leerink.com |
| Maxim Group | Jason Kolbert | jkolbert@maximgrp.com |
| Atlantic Equities | Steve Chesney | s.chesney@atlantic-equities.com |
| Cowen & Company | Phil Nadeau | phil.nadeau@cowen.com |
| Wells Fargo Securities | Jim Birchenough | jim.birchenough@wellsfargo.com |
| Needham | Alan Carr | acarr@needhamco.com |
| William Blair | John Sonnier | jsonnier@williamblair.com |
| BMO Capital Markets | M. Ian Somaiya | ian.somaiya@bmo.com |
| Credit Suisse | Alethia Young | alethia.young@credit-suisse.com |
| Evercore ISI | Mark Schoenebaum | mark.schoenebaum@evercoreisi.com |
| Guggenheim Securities | Tony Butler | tony.butler@guggenheimpartners.com |
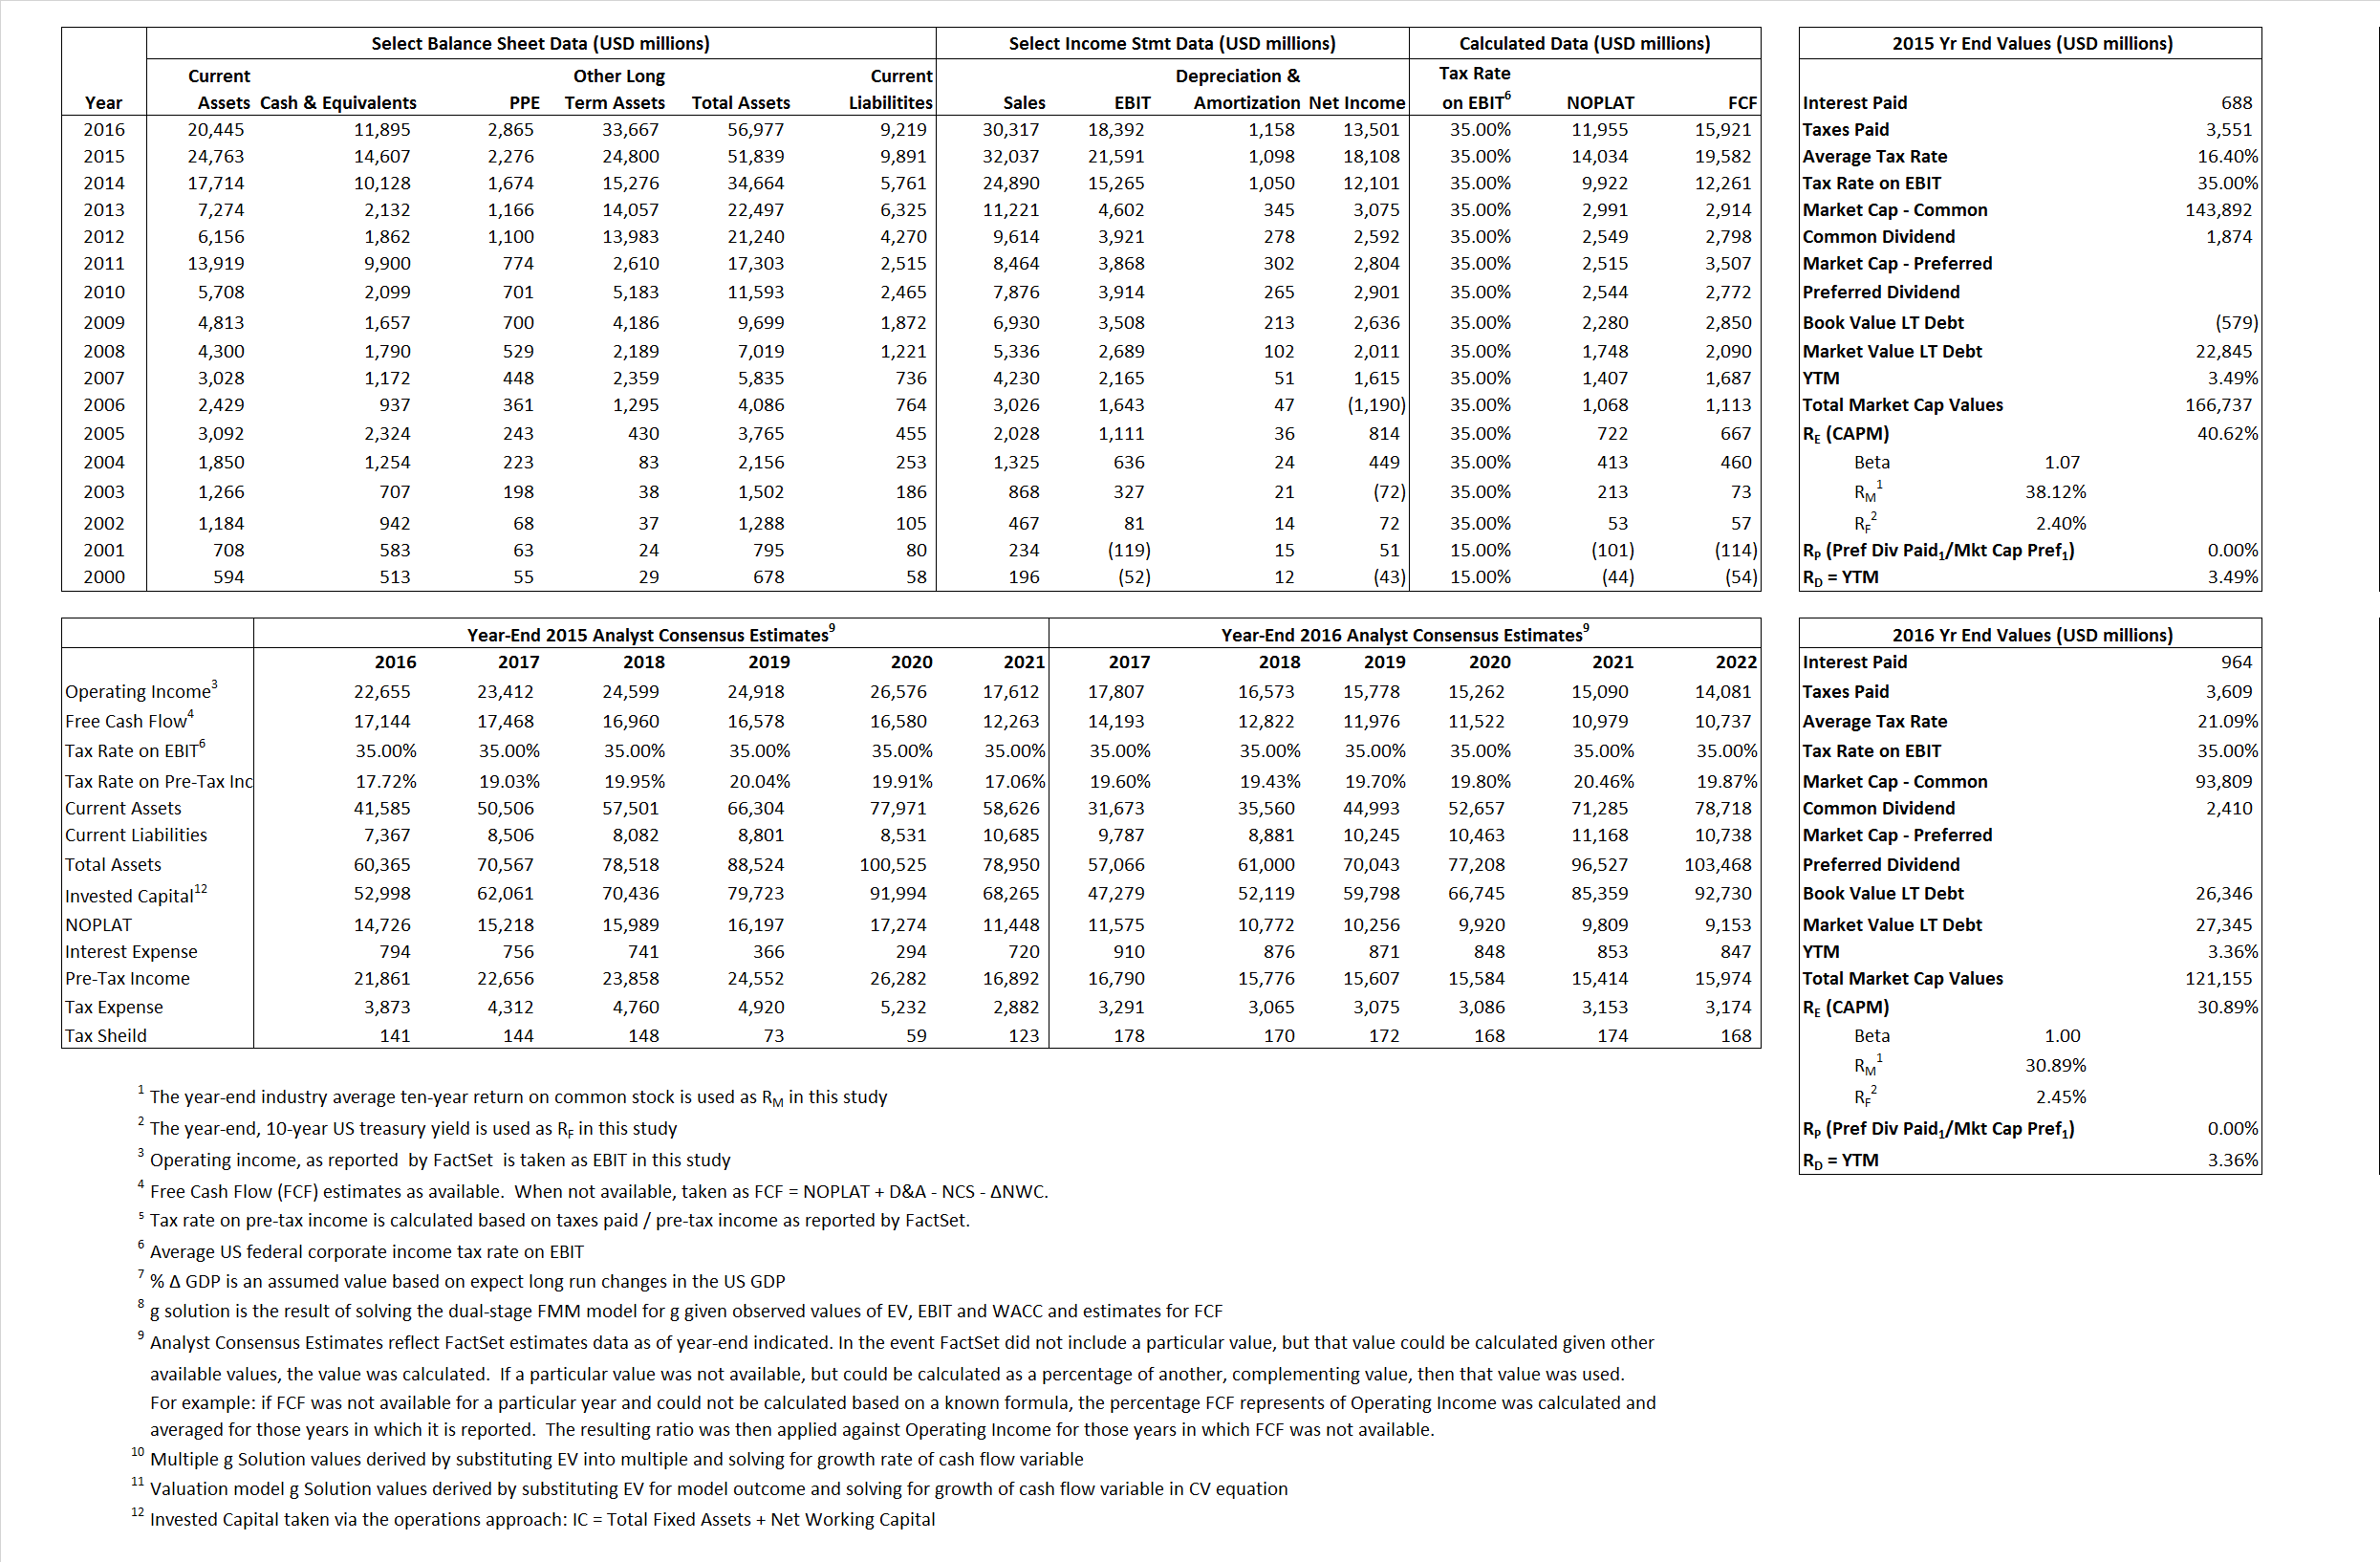
Primary Input Data
Derived Input Data
Derived Input |
Label |
2015 Value |
2016
|
Equational Form |
| Net Operating Profit Less Adjusted Taxes | NOPLAT | 14,034 | 11,955 |  |
| Free Cash Flow | FCF | 19,582 | 15,921 |  |
| Tax Shield | TS | 113 | 203 |  |
| Invested Capital | IC | 41,948 | 47,758 |  |
| Return on Invested Capital | ROIC | 33.46% | 25.03% |  |
| Net Investment | NetInv | 14,143 | 6,968 |  |
| Investment Rate | IR | 100.78% | 58.29% |  |
| Weighted Average Cost of Capital |
WACCMarket | 35.45% | 24.52% |  |
| WACCBook | 8.93% | 7.54% | ||
| Enterprise value |
EVMarket | 152,130 | 109,260 |  |
| EVBook | 128,706 | 108,260 | ||
| Long-Run Growth |
g = IR x ROIC |
33.72% | 14.59% | Long-run growth rates of the income variable are used in the Continuing Value portion of the valuation models. |
g = %  GDP GDP |
2.50% | 2.50% | ||
| Margin from Operations | M | 67.39% | 60.67% |  |
| Depreciation/Amortization Rate | D | 4.84% | 5.92% |  |
Valuation Multiple Outcomes
The outcomes presented in this study are the result of original input data, derived data, and synthesized inputs.
Equational Form |
Observed Value |
Single-stagemultiple g solution |
Two-stage valuationmodel g solution |
|||
| 12/31/2015 | 12/31/2016 | 12/31/2015 | 12/31/2016 | 12/31/2015 | 12/31/2016 | |
|
|
4.75 | 3.60 | 36.22% | 24.12% | 36.63% | 24.12% |
|
|
6.71 | 5.59 | 36.22% | 24.12% | 36.63% | 24.12% |
|
|
10.84 | 9.14 | 36.22% | 24.12% | 36.63% | 24.12% |
|
|
7.77 | 6.86 | 36.22% | 24.12% | 36.63% | 24.12% |
|
|
7.05 | 5.94 | 36.22% | 24.12% | 36.63% | 24.12% |
|
|
3.63 | 2.29 | 36.22% | 24.12% | 36.63% | 24.12% |


