Oracle Corporation
Analyst Listing
The following analysts provide coverage for the subject firm as of May 2016:
| Broker | Analyst | Analyst Email |
| Stifel Nicolaus | Brad R. Reback | rebackb@stifel.com |
| Pacific Crest Securities-KBCM | Brendan Barnicle | bbarnicle@pacific-crest.com |
| Drexel Hamilton | Brian J. White | bwhite@drexelhamilton.com |
| Oppenheimer | Brian Schwartz | brian.schwartz@opco.com |
| Atlantic Equities | Christopher Hickey | c.hickey@atlantic-equities.com |
| Nomura Research | Frederick Grieb | frederick.grieb@nomura.com |
| DA Davidson | Jack Andrews | jandrews@dadco.com |
| William Blair | Jason Ader | jader@williamblair.com |
| BTIG | Joel P. Fishbein | jfishbein@btig.com |
| Jefferies | John DiFucci | jdifucci@jefferies.com |
| SunTrust Robinson Humphrey | John Rizzuto | john.rizzuto@suntrust.com |
| Deutsche Bank Research | Karl Keirstead | karl.keirstead@db.com |
| Daiwa Securities Co. Ltd. | Kazuya Nishimura | kazuya.nishimura@us.daiwacm.com |
| BMO Capital Markets | Keith Bachman | keith.bachman@bmo.com |
| Evercore ISI | Kirk Materne | kirk.materne@evercoreisi.com |
| Bernstein Research | Mark L. Moerdler | mark.moerdler@bernstein.com |
| Northland Securities | Marshall Senk | msenk@northlandcapitalmarkets.com |
| Raymond James | Michael Turits | michael.turits@raymondjames.com |
| JMP Securities | Patrick Walravens | pwalravens@jmpsecurities.com |
| Credit Suisse | Philip Winslow | philip.winslow@credit-suisse.com |
| Canaccord Genuity | Richard Davis Jr. | rdavis@canaccordgenuity.com |
| Societe Generale | Richard Nguyen | richard.nguyen@sgcib.com |
| Wunderlich Securities | Rob Breza | robbreza@wundernet.com |
| RBC Capital Markets | Ross MacMillan | ross.macMillan@rbccm.com |
| Wedbush Securities | Steve Koenig | steve.koenig@wedbush.com |
Primary Input Data
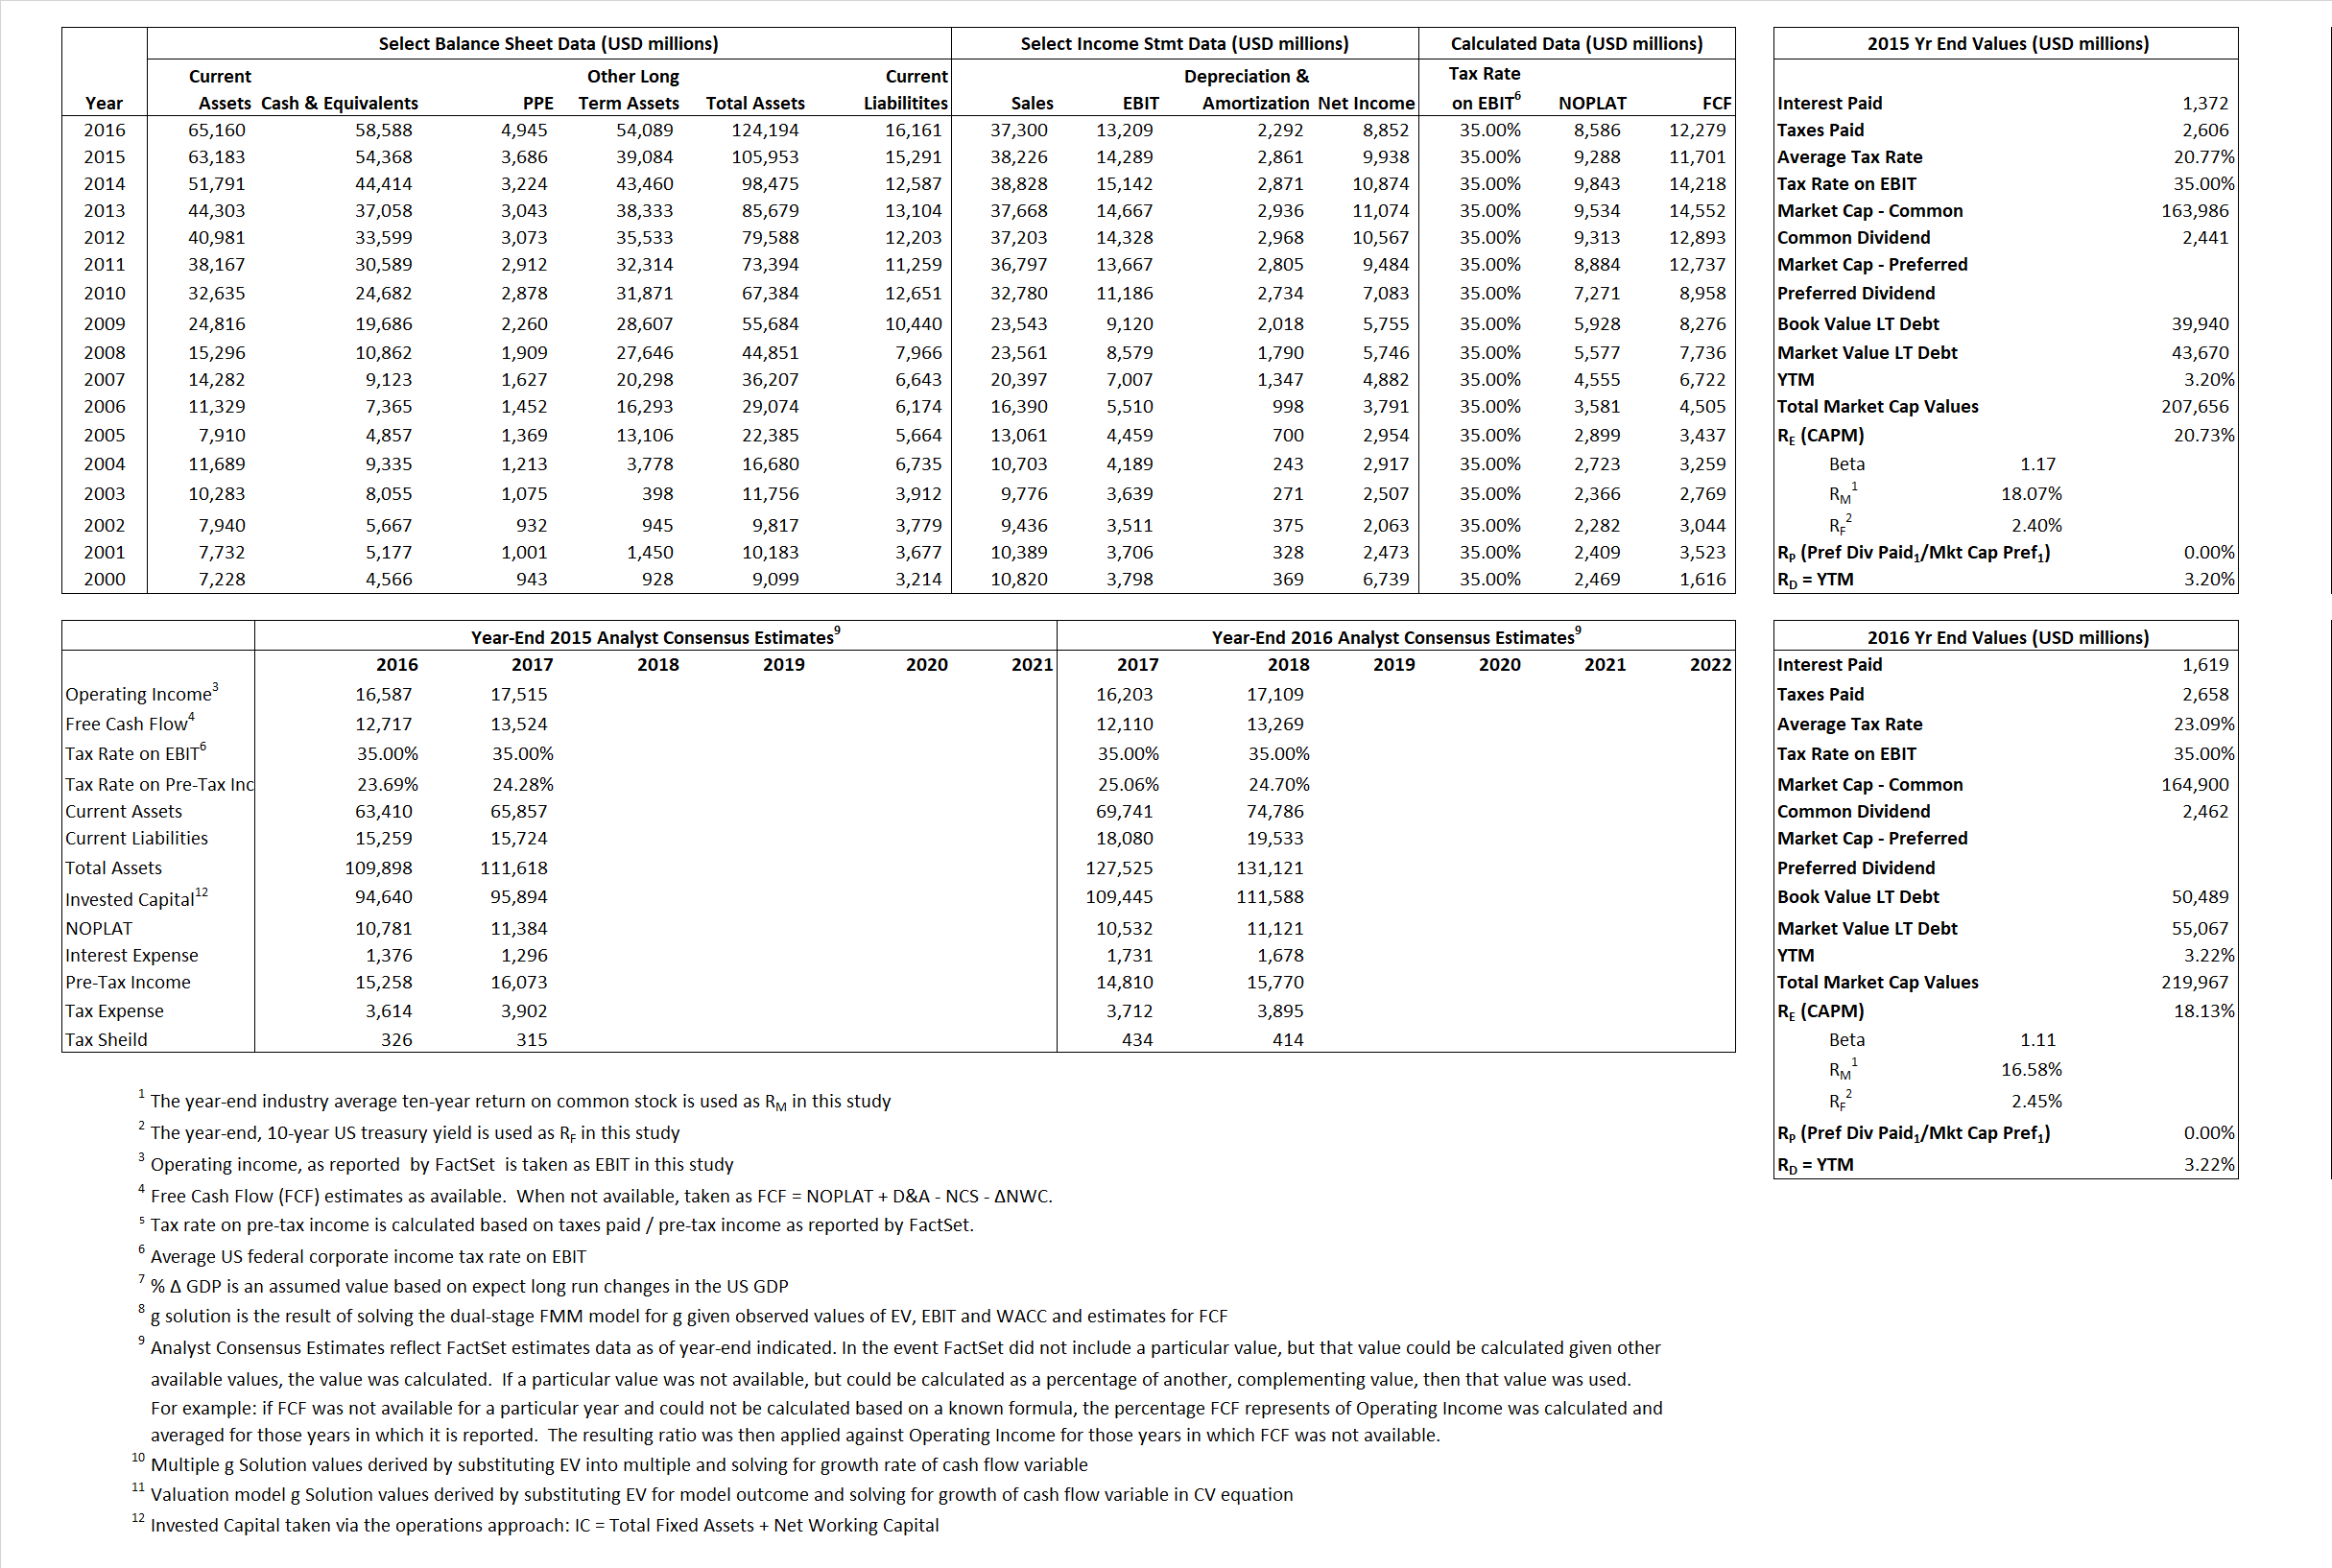
Derived Input Data
Derived Input |
Label |
2015 Value |
2016
|
Equational Form |
| Net Operating Profit Less Adjusted Taxes | NOPLAT | 9,288 | 8,586 |  |
| Free Cash Flow | FCF | 11,701 | 12,279 |  |
| Tax Shield | TS | 285 | 374 |  |
| Invested Capital | IC | 90,662 | 108,033 |  |
| Return on Invested Capital | ROIC | 10.24% | 7.95% |  |
| Net Investment | NetInv | 7,635 | 19,663 |  |
| Investment Rate | IR | 82.21% | 229.01% |  |
| Weighted Average Cost of Capital |
WACCMarket | 16.91% | 14.21% |  |
| WACCBook | 8.88% | 8.04% | ||
| Enterprise value |
EVMarket | 153,288 | 161,379 |  |
| EVBook | 145,338 | 156,801 | ||
| Long-Run Growth |
g = IR x ROIC |
8.42% | 18.20% | Long-run growth rates of the income variable are used in the Continuing Value portion of the valuation models. |
g = %  GDP GDP |
2.50% | 2.50% | ||
| Margin from Operations | M | 37.38% | 35.41% |  |
| Depreciation/Amortization Rate | D | 16.68% | 14.79% |  |
Valuation Multiple Outcomes
The outcomes presented in this study are the result of original input data, derived data, and synthesized inputs.
Equational Form |
Observed Value |
Single-stagemultiple g solution |
Two-stage valuationmodel g solution |
|||
| 12/31/2015 | 12/31/2016 | 12/31/2015 | 12/31/2016 | 12/31/2015 | 12/31/2016 | |
|
|
4.01 | 4.33 | 23.58% | 26.91% | 23.58% | 20.82% |
|
|
8.94 | 10.41 | 23.58% | 26.91% | 23.58% | 20.82% |
|
|
16.50 | 18.80 | 23.58% | 26.91% | 23.58% | 20.82% |
|
|
13.10 | 13.14 | 23.58% | 26.91% | 23.58% | 20.82% |
|
|
10.73 | 12.22 | 23.58% | 26.91% | 23.58% | 20.82% |
|
|
1.69 | 1.49 | 23.58% | 26.91% | 23.58% | 20.82% |


