Anadarko Petroleum
Analyst Listing
The following analysts provide coverage for the subject firm as of May 2016:
Primary Input Data
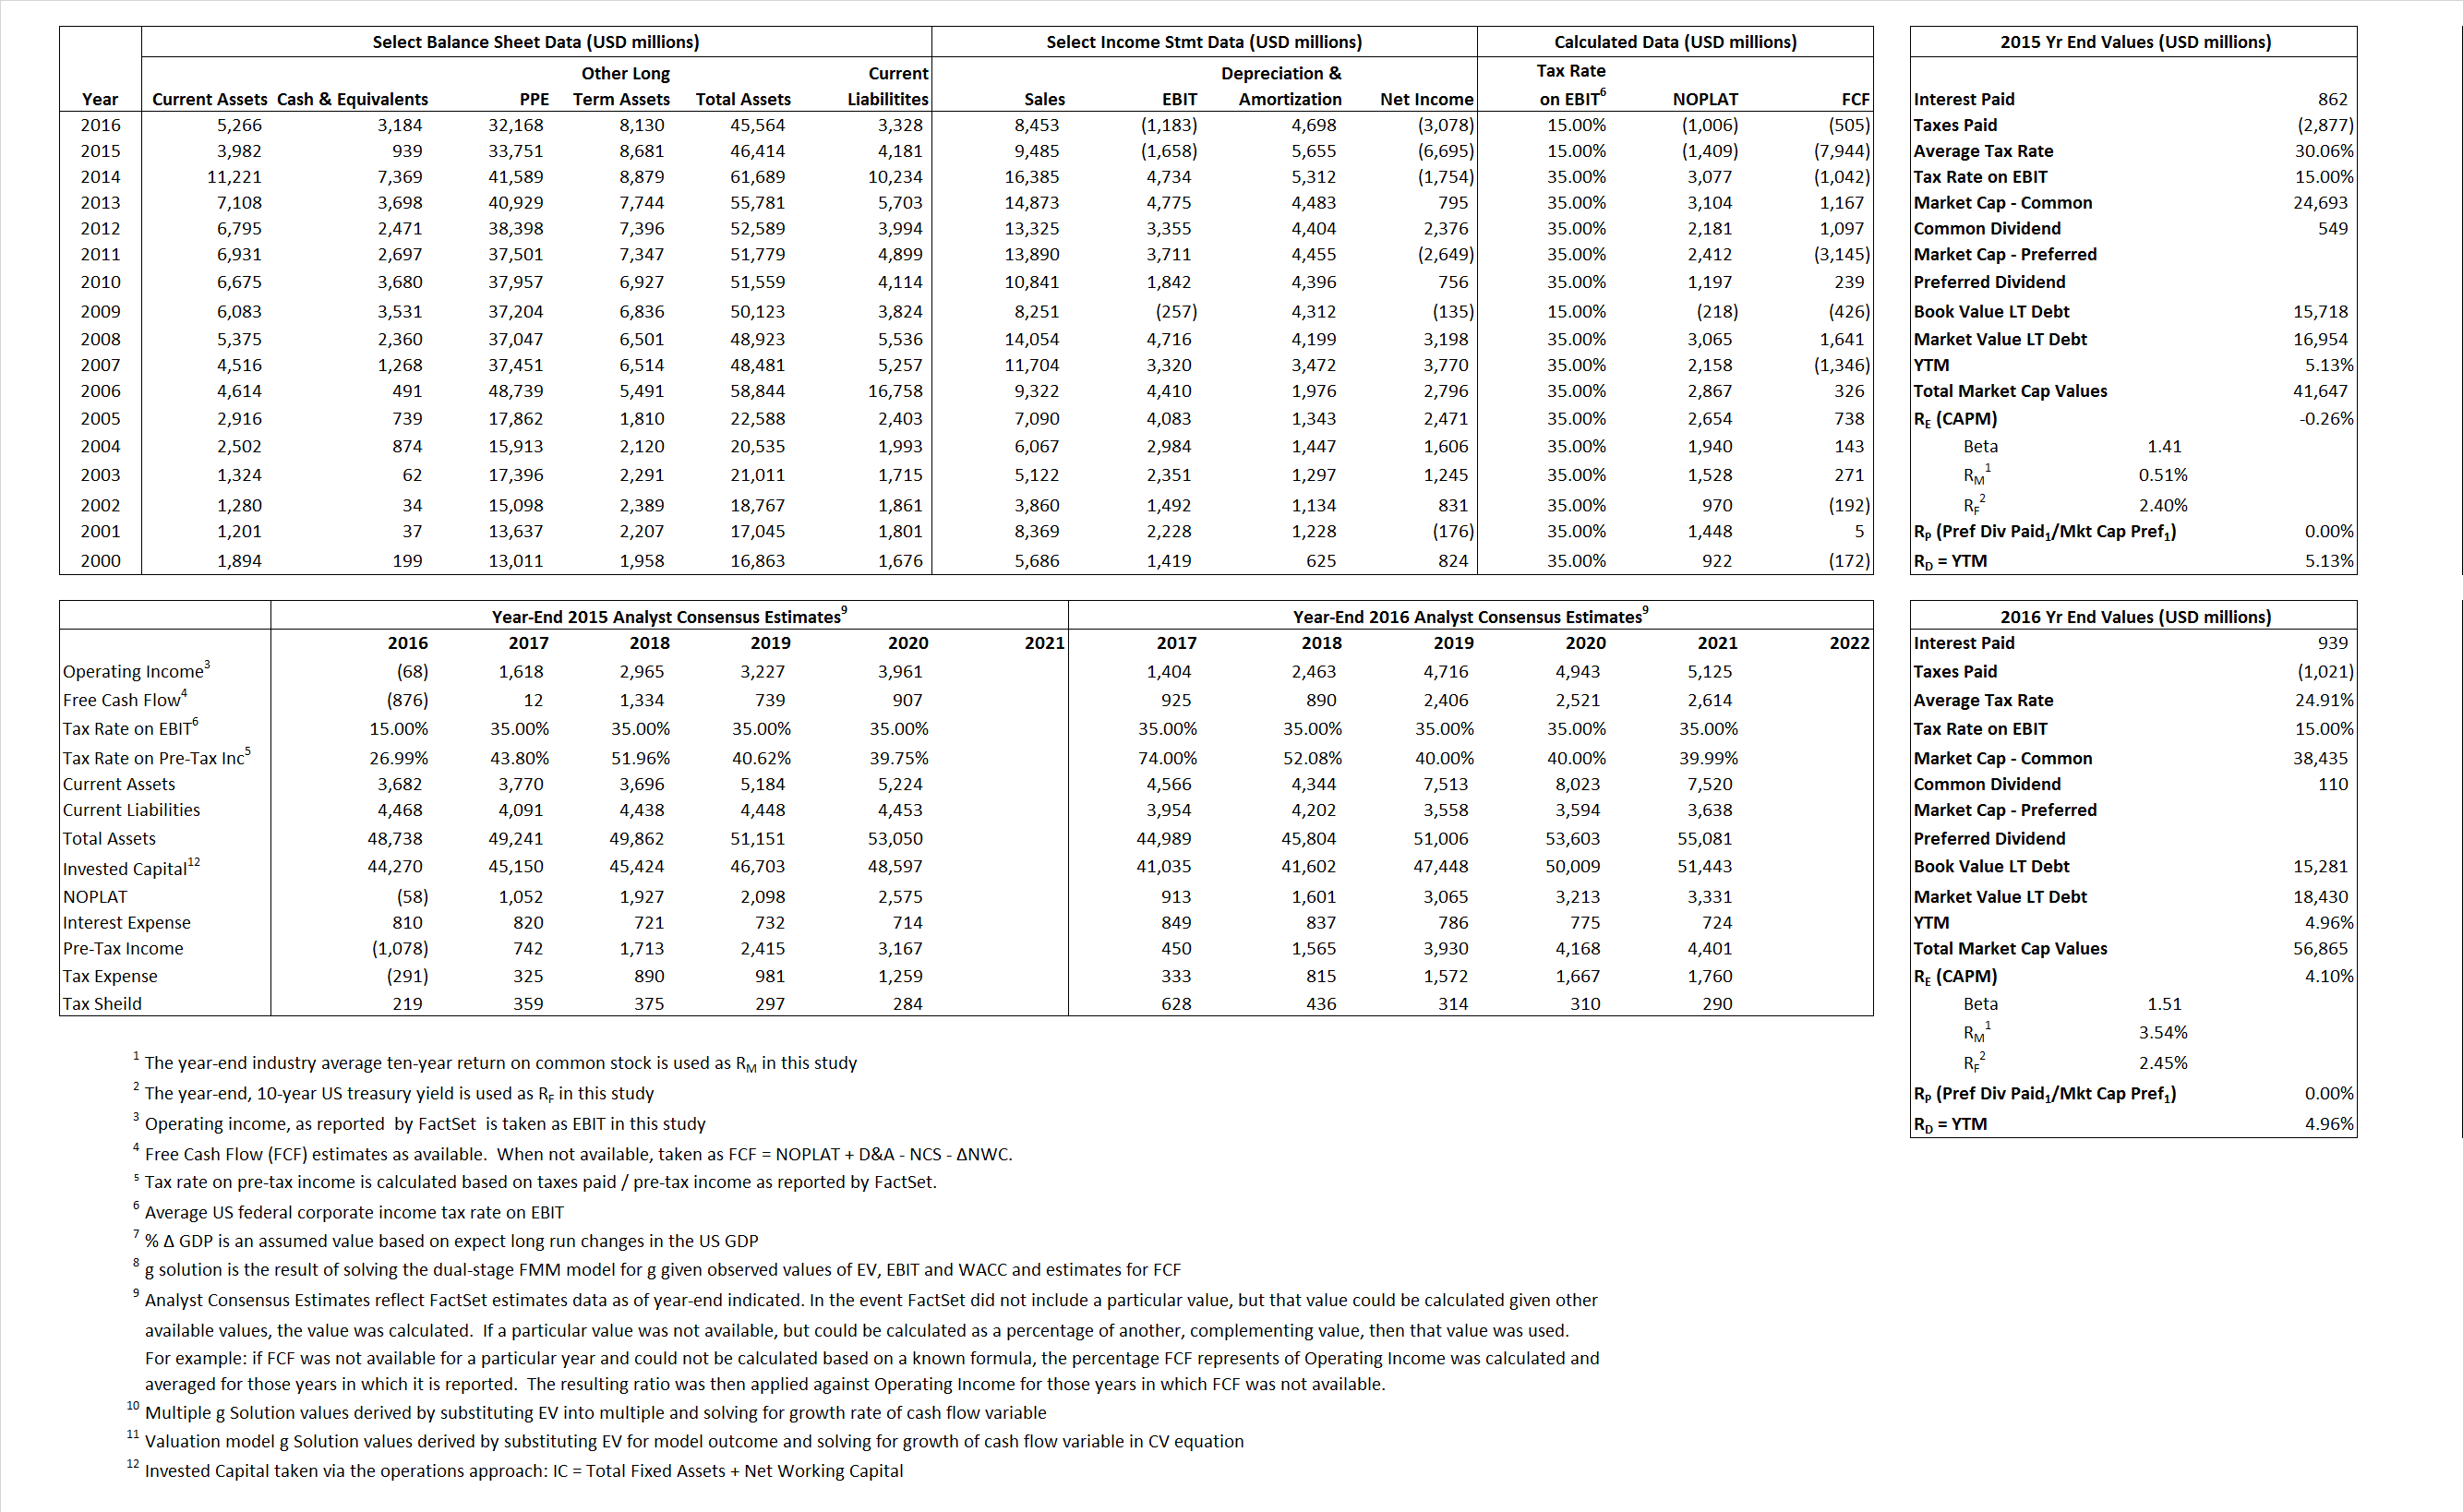
Derived Input Data
Derived Input |
Label |
2015 Value |
2016
|
Equational Form |
| Net Operating Profit Less Adjusted Taxes | NOPLAT | (1,409) | (1,006) |  |
| Free Cash Flow | FCF | (7,944) | (505) |  |
| Tax Shield | TS | 259 | 234 |  |
| Invested Capital | IC | 42,233 | 42,236 |  |
| Return on Invested Capital | ROIC | -3.34% | -2.38% |  |
| Net Investment | NetInv | (3,567) | 4,701 |  |
| Investment Rate | IR | 253.10% | -467.51% |  |
| Weighted Average Cost of Capital |
WACCMarket | 1.30% | 3.98% |  |
| WACCBook | 8.80% | 9.81% | ||
| Enterprise value |
EVMarket | 40,708 | 53,681 |  |
| EVBook | 39,472 | 50,532 | ||
| Long-Run Growth |
g = IR x ROIC |
-8.45% | 11.13% | Long-run growth rates of the income variable are used in the Continuing Value portion of the valuation models. |
g = %  GDP GDP |
2.50% | 2.50% | ||
| Margin from Operations | M | -17.48% | -14.00% |  |
| Depreciation/Amortization Rate | D | 141.48% | 133.66% |  |
Valuation Multiple Outcomes
The outcomes presented in this study are the result of original input data, derived data, and synthesized inputs.
Equational Form |
Observed Value |
Single-stagemultiple g solution |
Two-stage valuationmodel g solution |
|||
| 12/31/2015 | 12/31/2016 | 12/31/2015 | 12/31/2016 | 12/31/2015 | 12/31/2016 | |
|
|
4.29 | 6.35 | -127.21% | 27.43% | -212.61% | 15.65% |
|
|
10.18 | 15.27 | -127.21% | 27.43% | -212.61% | 15.65% |
|
|
-28.89 | -53.38 | -127.21% | 27.43% | -212.61% | 15.65% |
|
|
-5.12 | -106.30 | -127.21% | 27.43% | -212.61% | 15.65% |
|
|
-24.55 | -45.38 | -127.21% | 27.43% | -212.61% | 15.65% |
|
|
.96 | 1.27 | -127.21% | 27.43% | -212.61% | 15.65% |


