ConocoPhillips
Analyst Listing
The following analysts provide coverage for the subject firm as of May 2016:
| Broker | Analyst | Analyst Email |
| Scotia Howard Weil | Blake Fernandez | blake.fernandez@scotiabank.com |
| Cowen & Company | Charles Robertson | charles.robertson@cowen.com |
| Evercore ISI | Douglas Terreson | doug.terreson@evercoreisi.com |
| Credit Suisse | Edward Westlake | edward.westlake@credit-suisse.com |
| Piper Jaffray | Guy Baber | guy.a.baber@simmonspjc.com |
| Alembic Global Advisors | James Sullivan | james.sullivan@alembicglobal.com |
| Jefferies | Jason Gammel | jason.gammel@jefferies.com |
| Nomura Research | Lloyd Byrne | lloyd.byrne@nomura.com |
| Wolfe Research | Paul Sankey | psankey@wolferesearch.com |
| Raymond James | Pavel Molchanov | pavel.molchanov@raymondjames.com |
| Wells Fargo Securities | Roger D. Read | roger.read@wellsfargo.com |
| Deutsche Bank Research | Ryan Todd | ryan.todd@db.com |
| RBC Capital Markets | Scott Hanold | scott.hanold@rbccm.com |
Primary Input Data
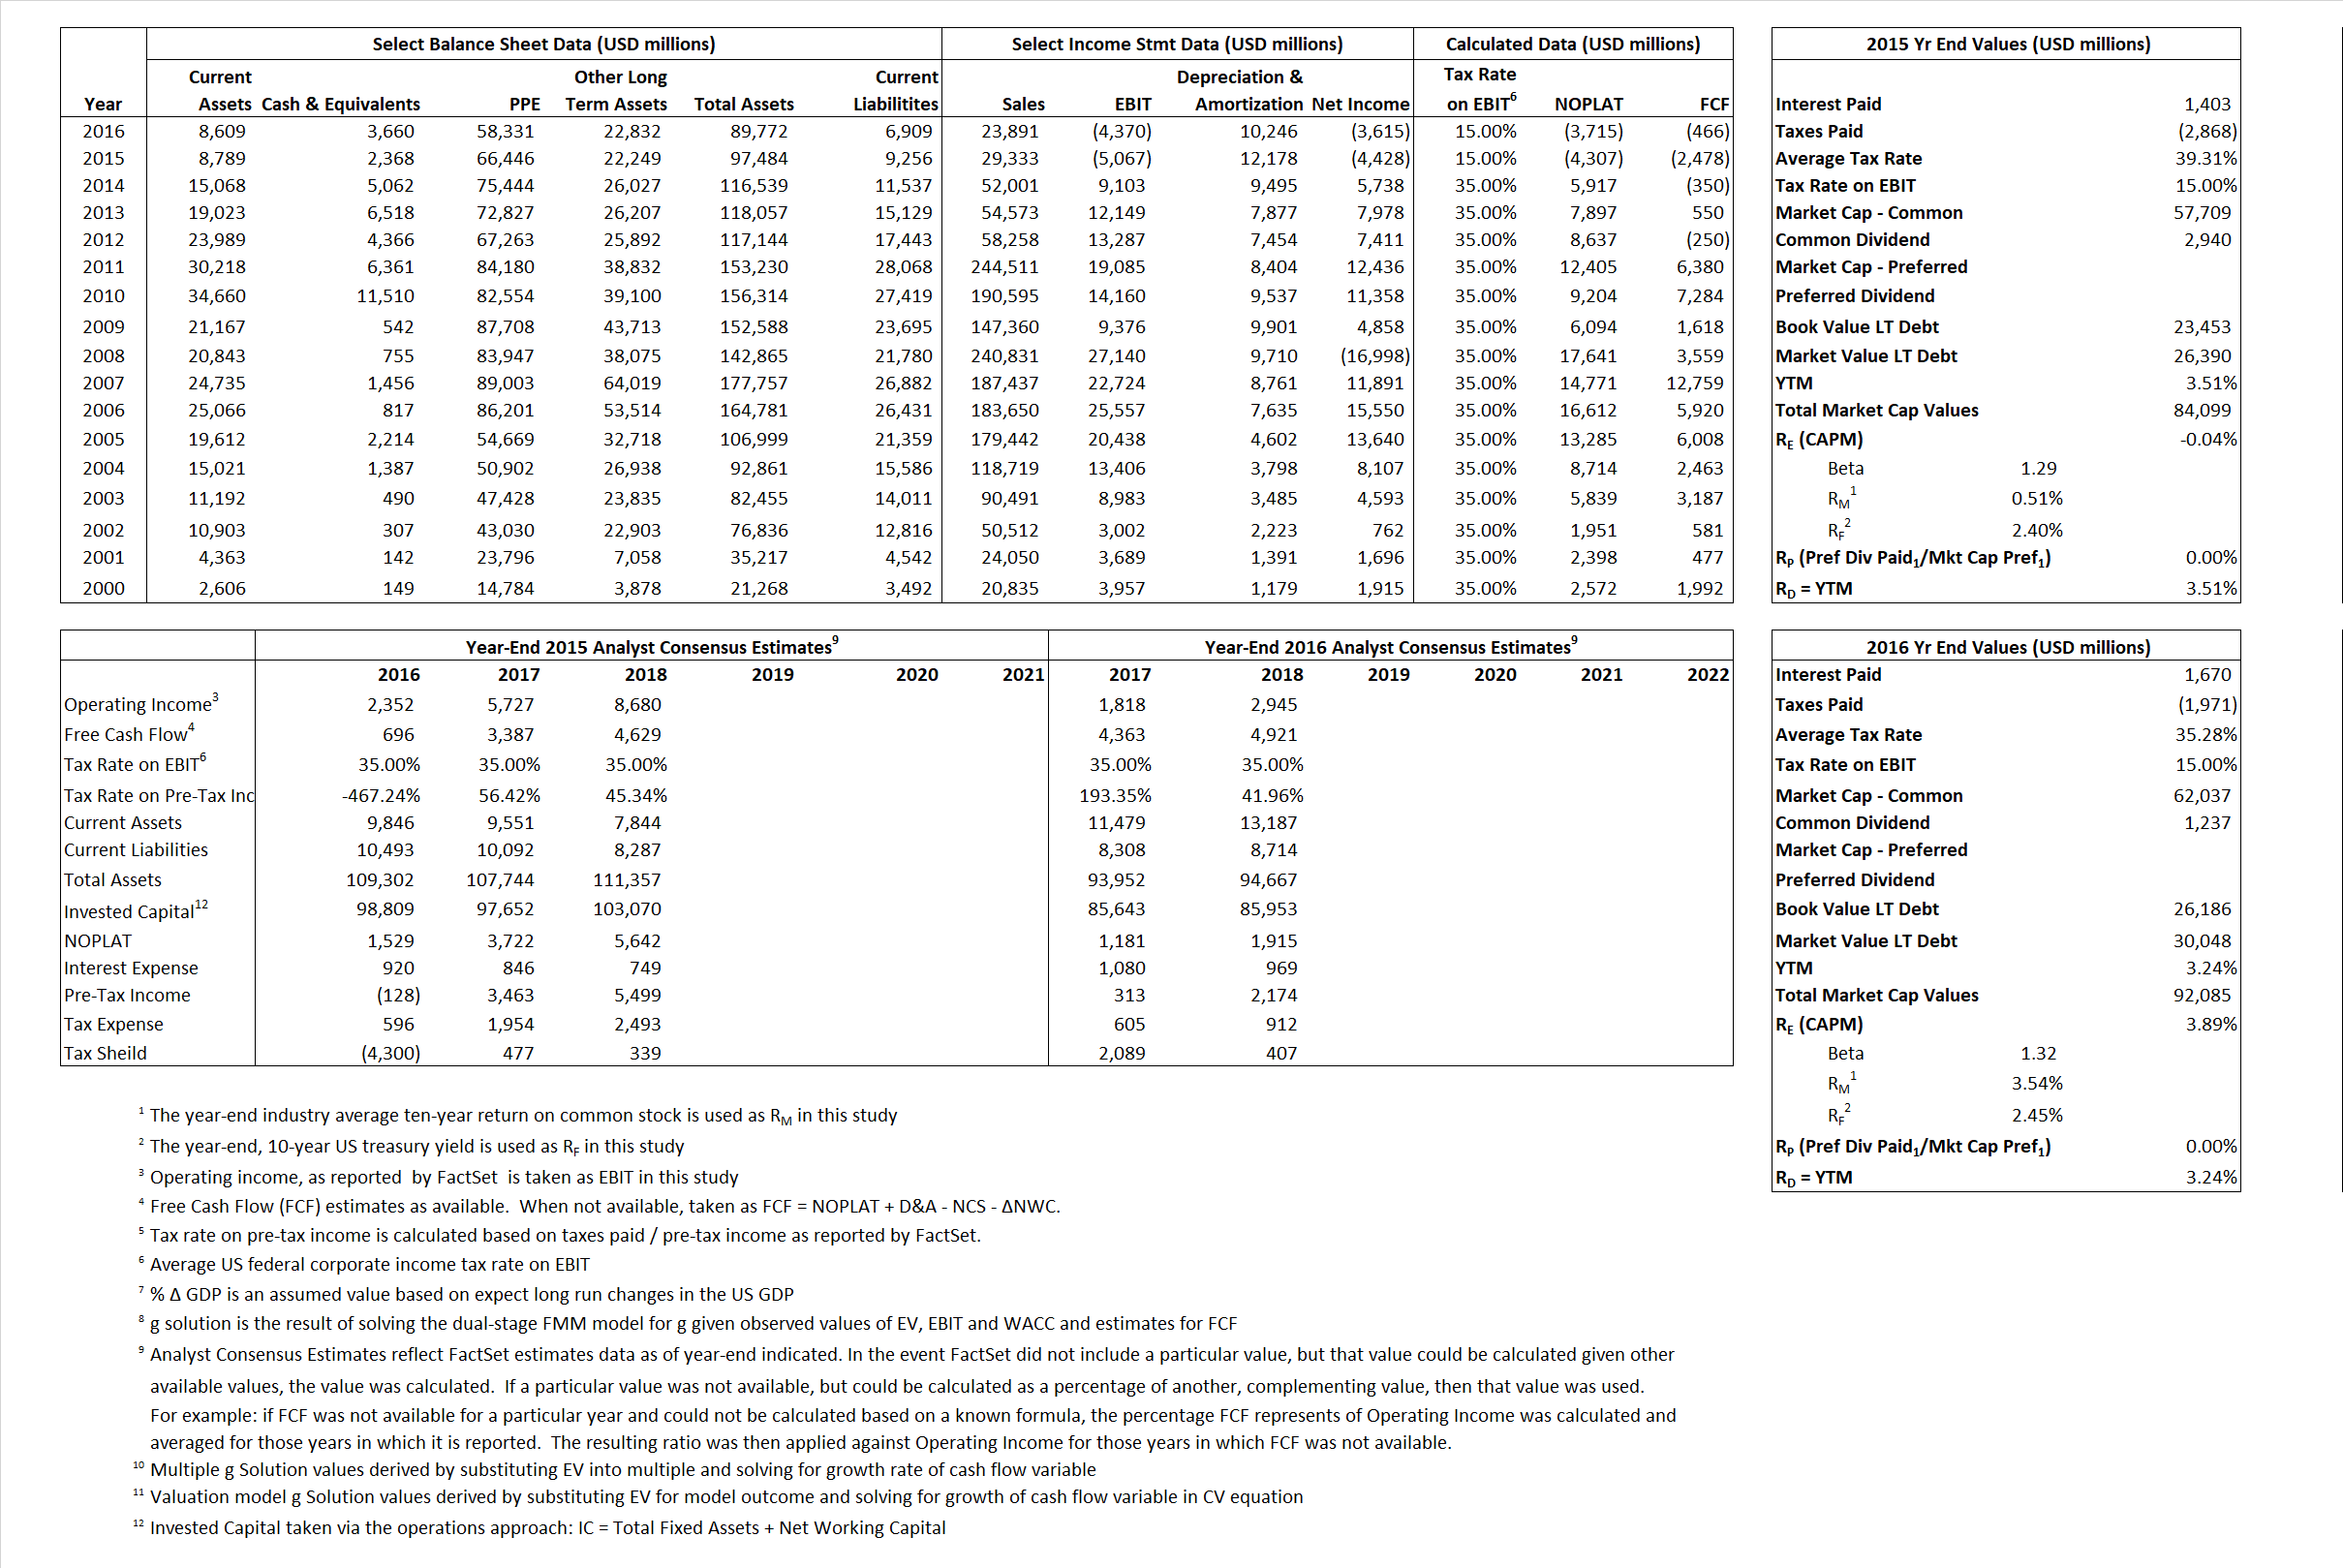
Derived Input Data
Derived Input |
Label |
2015 Value |
2016
|
Equational Form |
| Net Operating Profit Less Adjusted Taxes | NOPLAT | (4,307) | (3,715) |  |
| Free Cash Flow | FCF | (2,478) | (466) |  |
| Tax Shield | TS | 552 | 589 |  |
| Invested Capital | IC | 88,228 | 82,863 |  |
| Return on Invested Capital | ROIC | -4.88% | -4.48% |  |
| Net Investment | NetInv | (4,596) | 4,881 |  |
| Investment Rate | IR | 106.71% | -131.40% |  |
| Weighted Average Cost of Capital |
WACCMarket | 0.64% | 3.30% |  |
| WACCBook | 8.85% | 8.64% | ||
| Enterprise value |
EVMarket | 81,731 | 88,425 |  |
| EVBook | 78,794 | 84,563 | ||
| Long-Run Growth |
g = IR x ROIC |
-5.21% | 5.89% | Long-run growth rates of the income variable are used in the Continuing Value portion of the valuation models. |
g = %  GDP GDP |
2.50% | 2.50% | ||
| Margin from Operations | M | -17.27% | -18.29% |  |
| Depreciation/Amortization Rate | D | 171.26% | 174.37% |  |
Valuation Multiple Outcomes
The outcomes presented in this study are the result of original input data, derived data, and synthesized inputs.
Equational Form |
Observed Value |
Single-stagemultiple g solution |
Two-stage valuationmodel g solution |
|||
| 12/31/2015 | 12/31/2016 | 12/31/2015 | 12/31/2016 | 12/31/2015 | 12/31/2016 | |
|
|
2.79 | 3.70 | -74.37% | 119.32% | -35.05% | 59.40% |
|
|
11.49 | 15.05 | -74.37% | 119.32% | -35.05% | 59.40% |
|
|
-18.98 | -23.81 | -74.37% | 119.32% | -35.05% | 59.40% |
|
|
-32.98 | -189.75 | -74.37% | 119.32% | -35.05% | 59.40% |
|
|
-16.13 | -20.23 | -74.37% | 119.32% | -35.05% | 59.40% |
|
|
0.93 | 1.07 | -74.37% | 119.32% | -35.05% | 59.40% |


