Minnesota Mining & Manufacturing (3M)
Analyst Listing
The following analysts provide coverage for the subject firm as of May 2016:
| Broker | Analyst | Analyst Email |
| Morningstar | Barbara Noverini | barbara.noverini@morningstar.com |
| Langenberg, LLC | Brian K. Langenberg | brian@langenberg-llc.com |
| RBC Capital Markets | Deane M. Dray | deane.dray@rbccm.com |
| Argus Research | John Eade | jeade@argusresearch.com |
| Deutsche Bank Research | John G. Inch | john.inch@db.com |
| Credit Suisse | Julian Mitchell | julian.mitchell@credit-suisse.com |
| Jefferies | Laurence Alexander | lalexander@jefferies.com |
| Erste Group | Martin Krajhanzl | mkrajhanzl@csas.cz |
| William Blair | Nicholas P. Heymann | nheymann@williamblair.com |
| Stifel Nicolaus | Robert P. McCarthy | mccarthyr@stifel.com |
| Hilliard Lyons | Spencer E. Joyce | sjoyce@hilliard.com |
| Bernstein Research | Steven E. Winoker | steven.winoker@bernstein.com |
| Stifel Nicolaus | Robert P. McCarthy | mccarthyr@stifel.com |
| Bernstein Research | Steven E. Winoker | steven.winoker@bernstein.com |
| Langenberg, LLC | Brian K. Langenberg | brian@langenberg-llc.com |
| Deutsche Bank Research | John G. Inch | john.inch@db.com |
| RBC Capital Markets | Deane M. Dray | deane.dray@rbccm.com |
| Hilliard Lyons | Spencer E. Joyce | sjoyce@hilliard.com |
| Jefferies | Laurence Alexander | lalexander@jefferies.com |
| William Blair | Nicholas P. Heymann | nheymann@williamblair.com |
| Credit Suisse | Julian Mitchell | julian.mitchell@credit-suisse.com |
Primary Input Data
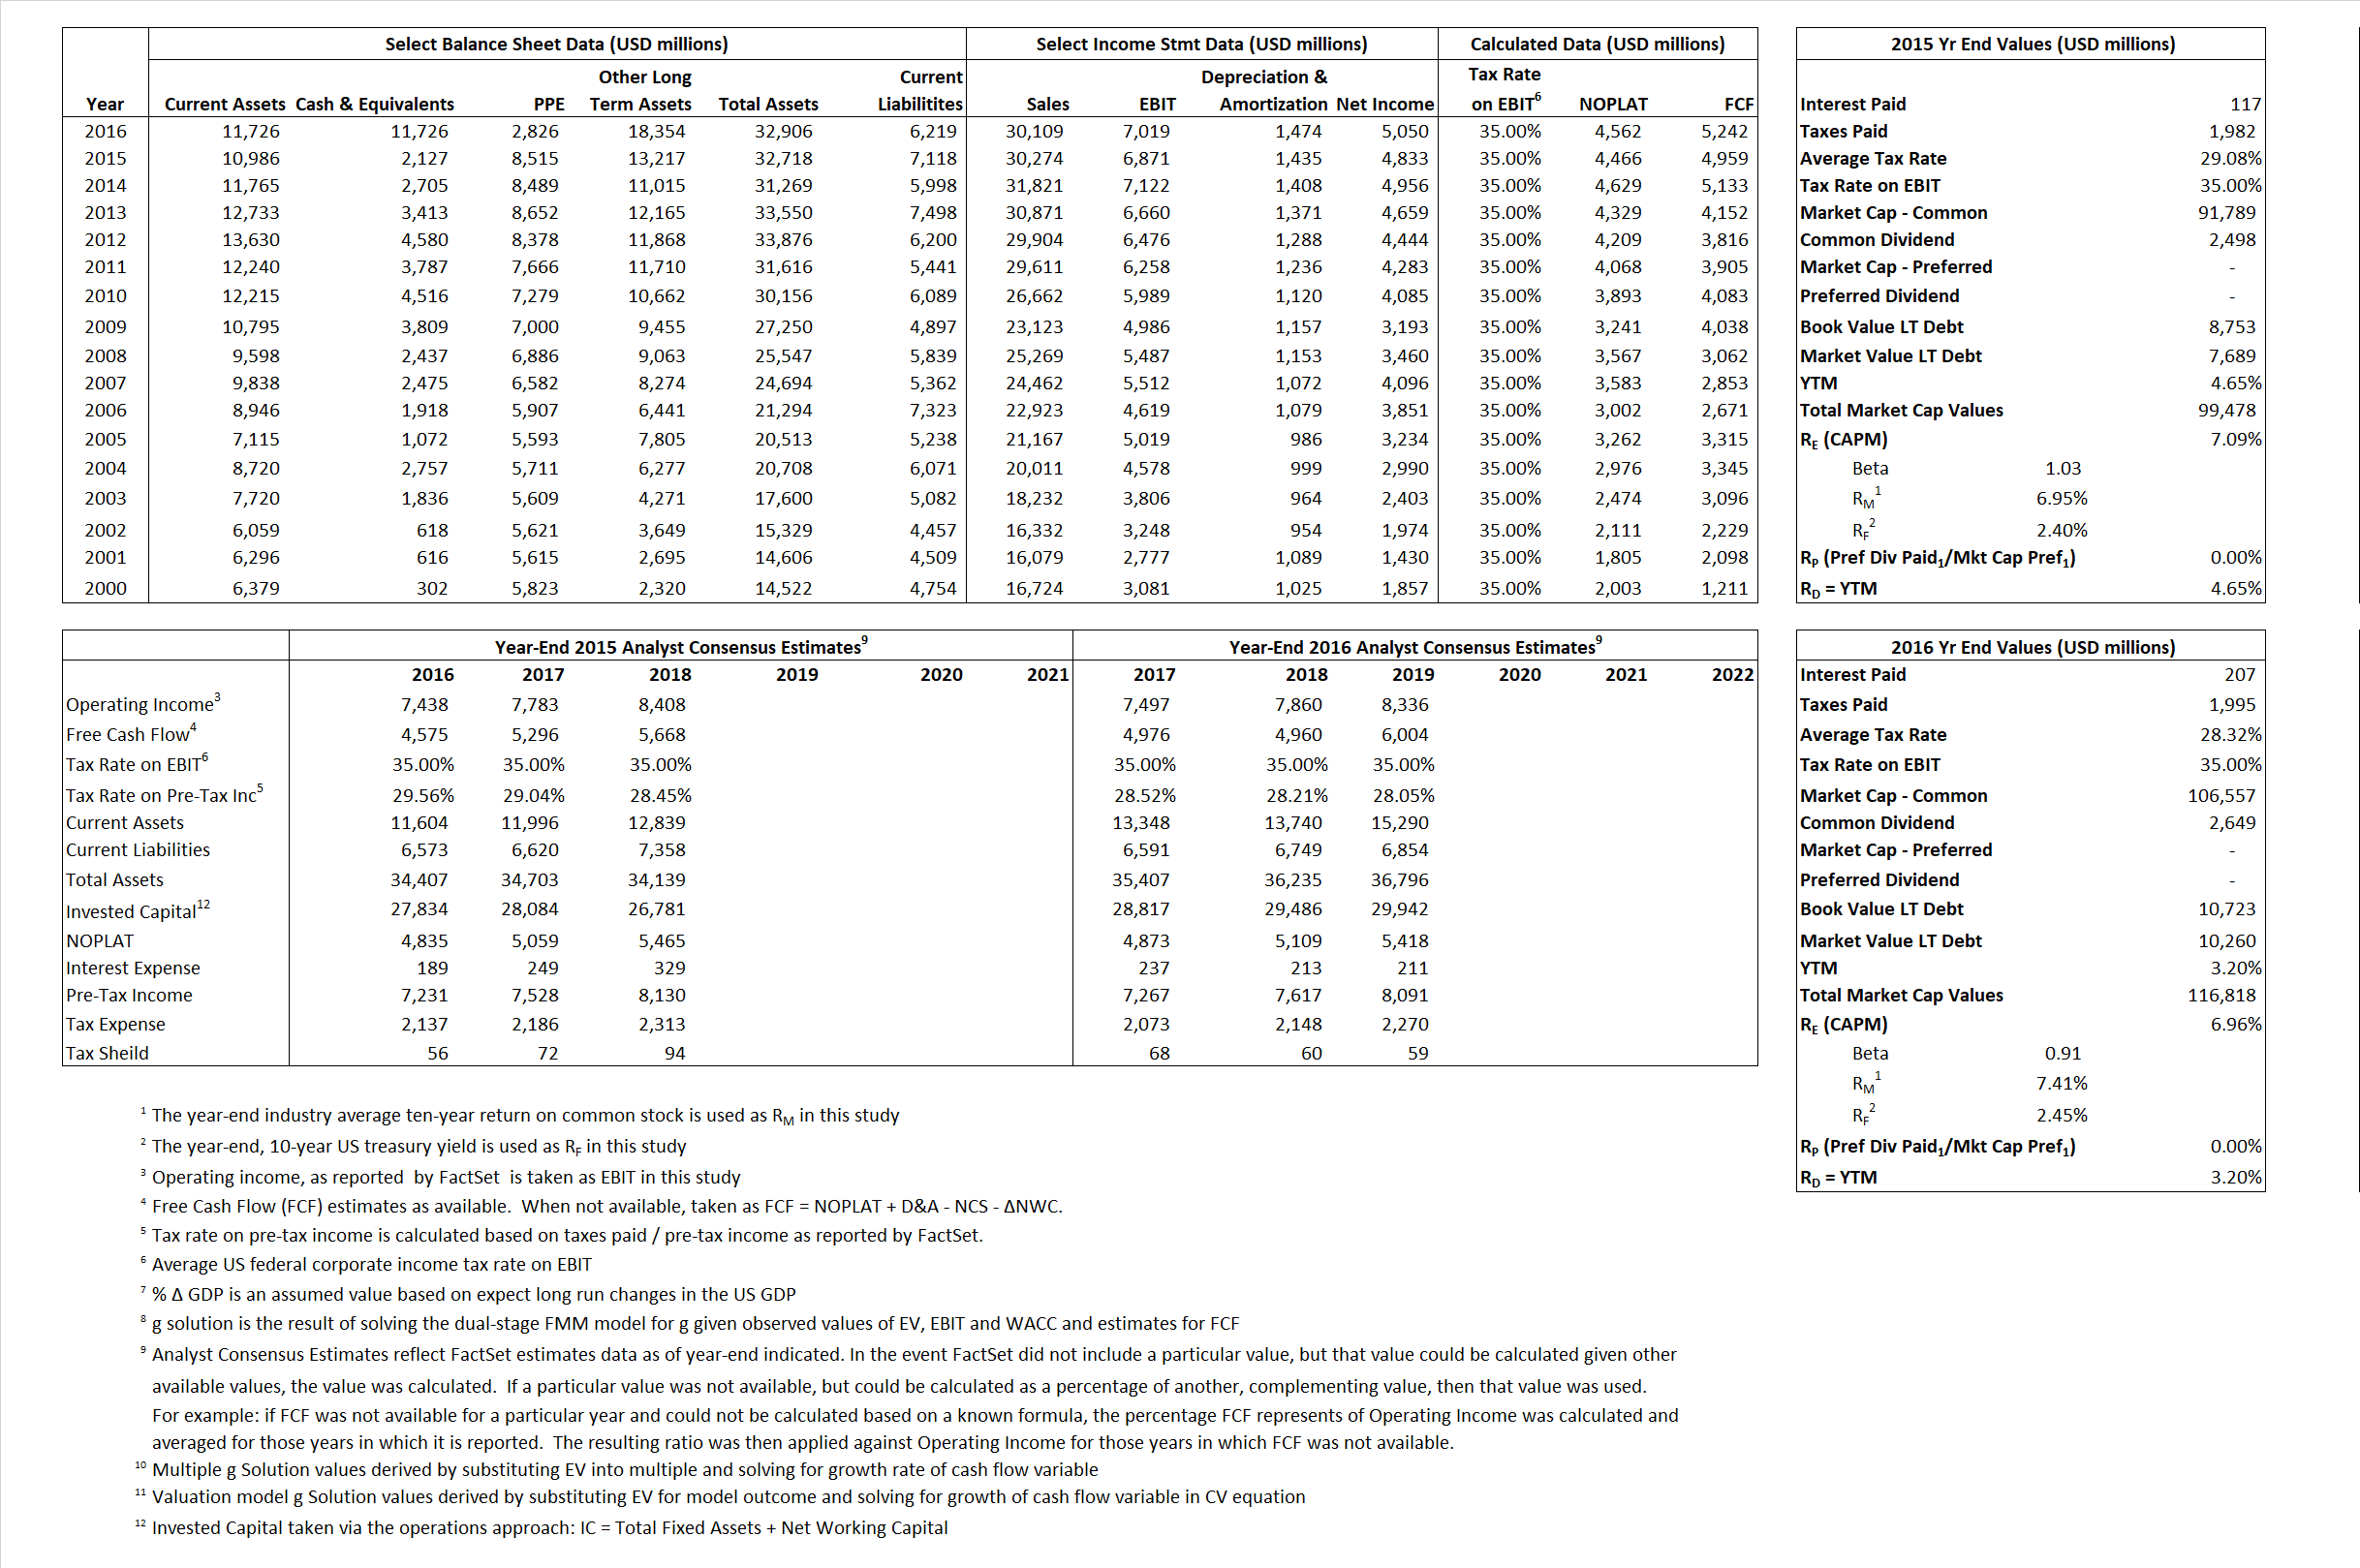
Derived Input Data
Derived Input |
Label |
2015 Value |
2016
|
Equational Form |
| Net Operating Profit Less Adjusted Taxes | NOPLAT | 4,466 | 4,562 |  |
| Free Cash Flow | FCF | 4,959 | 5,242 |  |
| Tax Shield | TS | 34 | 59 |  |
| Invested Capital | IC | 25,600 | 26,687 |  |
| Return on Invested Capital | ROIC | 17.45% | 17.10% |  |
| Net Investment | NetInv | 1,764 | 2,561 |  |
| Investment Rate | IR | 39.50% | 56.13% |  |
| Weighted Average Cost of Capital |
WACCMarket | 6.79% | 6.55% |  |
| WACCBook | 8.76% | 7.77% | ||
| Enterprise value |
EVMarket | 97,351 | 105,092 |  |
| EVBook | 88,816 | 105,554 | ||
| Long-Run Growth |
g = IR x ROIC |
6.89% | 9.60% | Long-run growth rates of the income variable are used in the Continuing Value portion of the valuation models. |
g = %  GDP GDP |
2.50% | 2.50% | ||
| Margin from Operations | M | 22.70% | 23.31% |  |
| Depreciation/Amortization Rate | D | 17.28% | 17.36% |  |
Valuation Multiple Outcomes
The outcomes presented in this study are the result of original input data, derived data, and synthesized inputs.
Equational Form |
Observed Value |
Single-stagemultiple g solution |
Two-stage valuationmodel g solution |
|||
| 12/31/2015 | 12/31/2016 | 12/31/2015 | 12/31/2016 | 12/31/2015 | 12/31/2016 | |
|
|
3.22 | 3.49 | 2.99% | 2.97% | 3.23% | 3.75% |
|
|
11.72 | 12.37 | 2.99% | 2.97% | 3.23% | 3.75% |
|
|
21.80 | 23.03 | 2.99% | 2.97% | 3.23% | 3.75% |
|
|
19.63 | 20.05 | 2.99% | 2.97% | 3.23% | 3.75% |
|
|
14.17 | 14.97 | 2.99% | 2.97% | 3.23% | 3.75% |
|
|
3.80 | 3.94 | 2.99% | 2.97% | 3.23% | 3.75% |


