Ford Motor
Analyst Listing
The following analysts provide coverage for the subject firm as of May 2016:
| Broker | Analyst | Analyst Email |
| KeyBanc Capital Markets | Brett D. Hoselton | bhoselton@key.com |
| Morningstar | David Whiston | david.whiston@morningstar.com |
| Daiwa Securities Co. Ltd. | Jairam Nathan | jairam.nathan@us.daiwacm.com |
| Buckingham Research | Joseph C. Amaturo | jamaturo@buckresearch.com |
| RBC Capital Markets | Joseph Spak | joseph.spak@rbccm.com |
| Susquehanna Financial Group | Matthew T. Stover | matthew.stover@sig.com |
| CRT Capital Group | Michael Ward | mward@sterneageecrt.com |
| Eugene Investment & Securities | Moon-Su Chang | moonsu.chang@eugenefn.com |
| Deutsche Bank Research | Rod Lache | rod.lache@db.com |
| Craig Hallum Capital Group | Steve L. Dyer | sdyer@craig-hallum.com |
| Argus Research | William Selesky | bselesky@argusresearch.com |
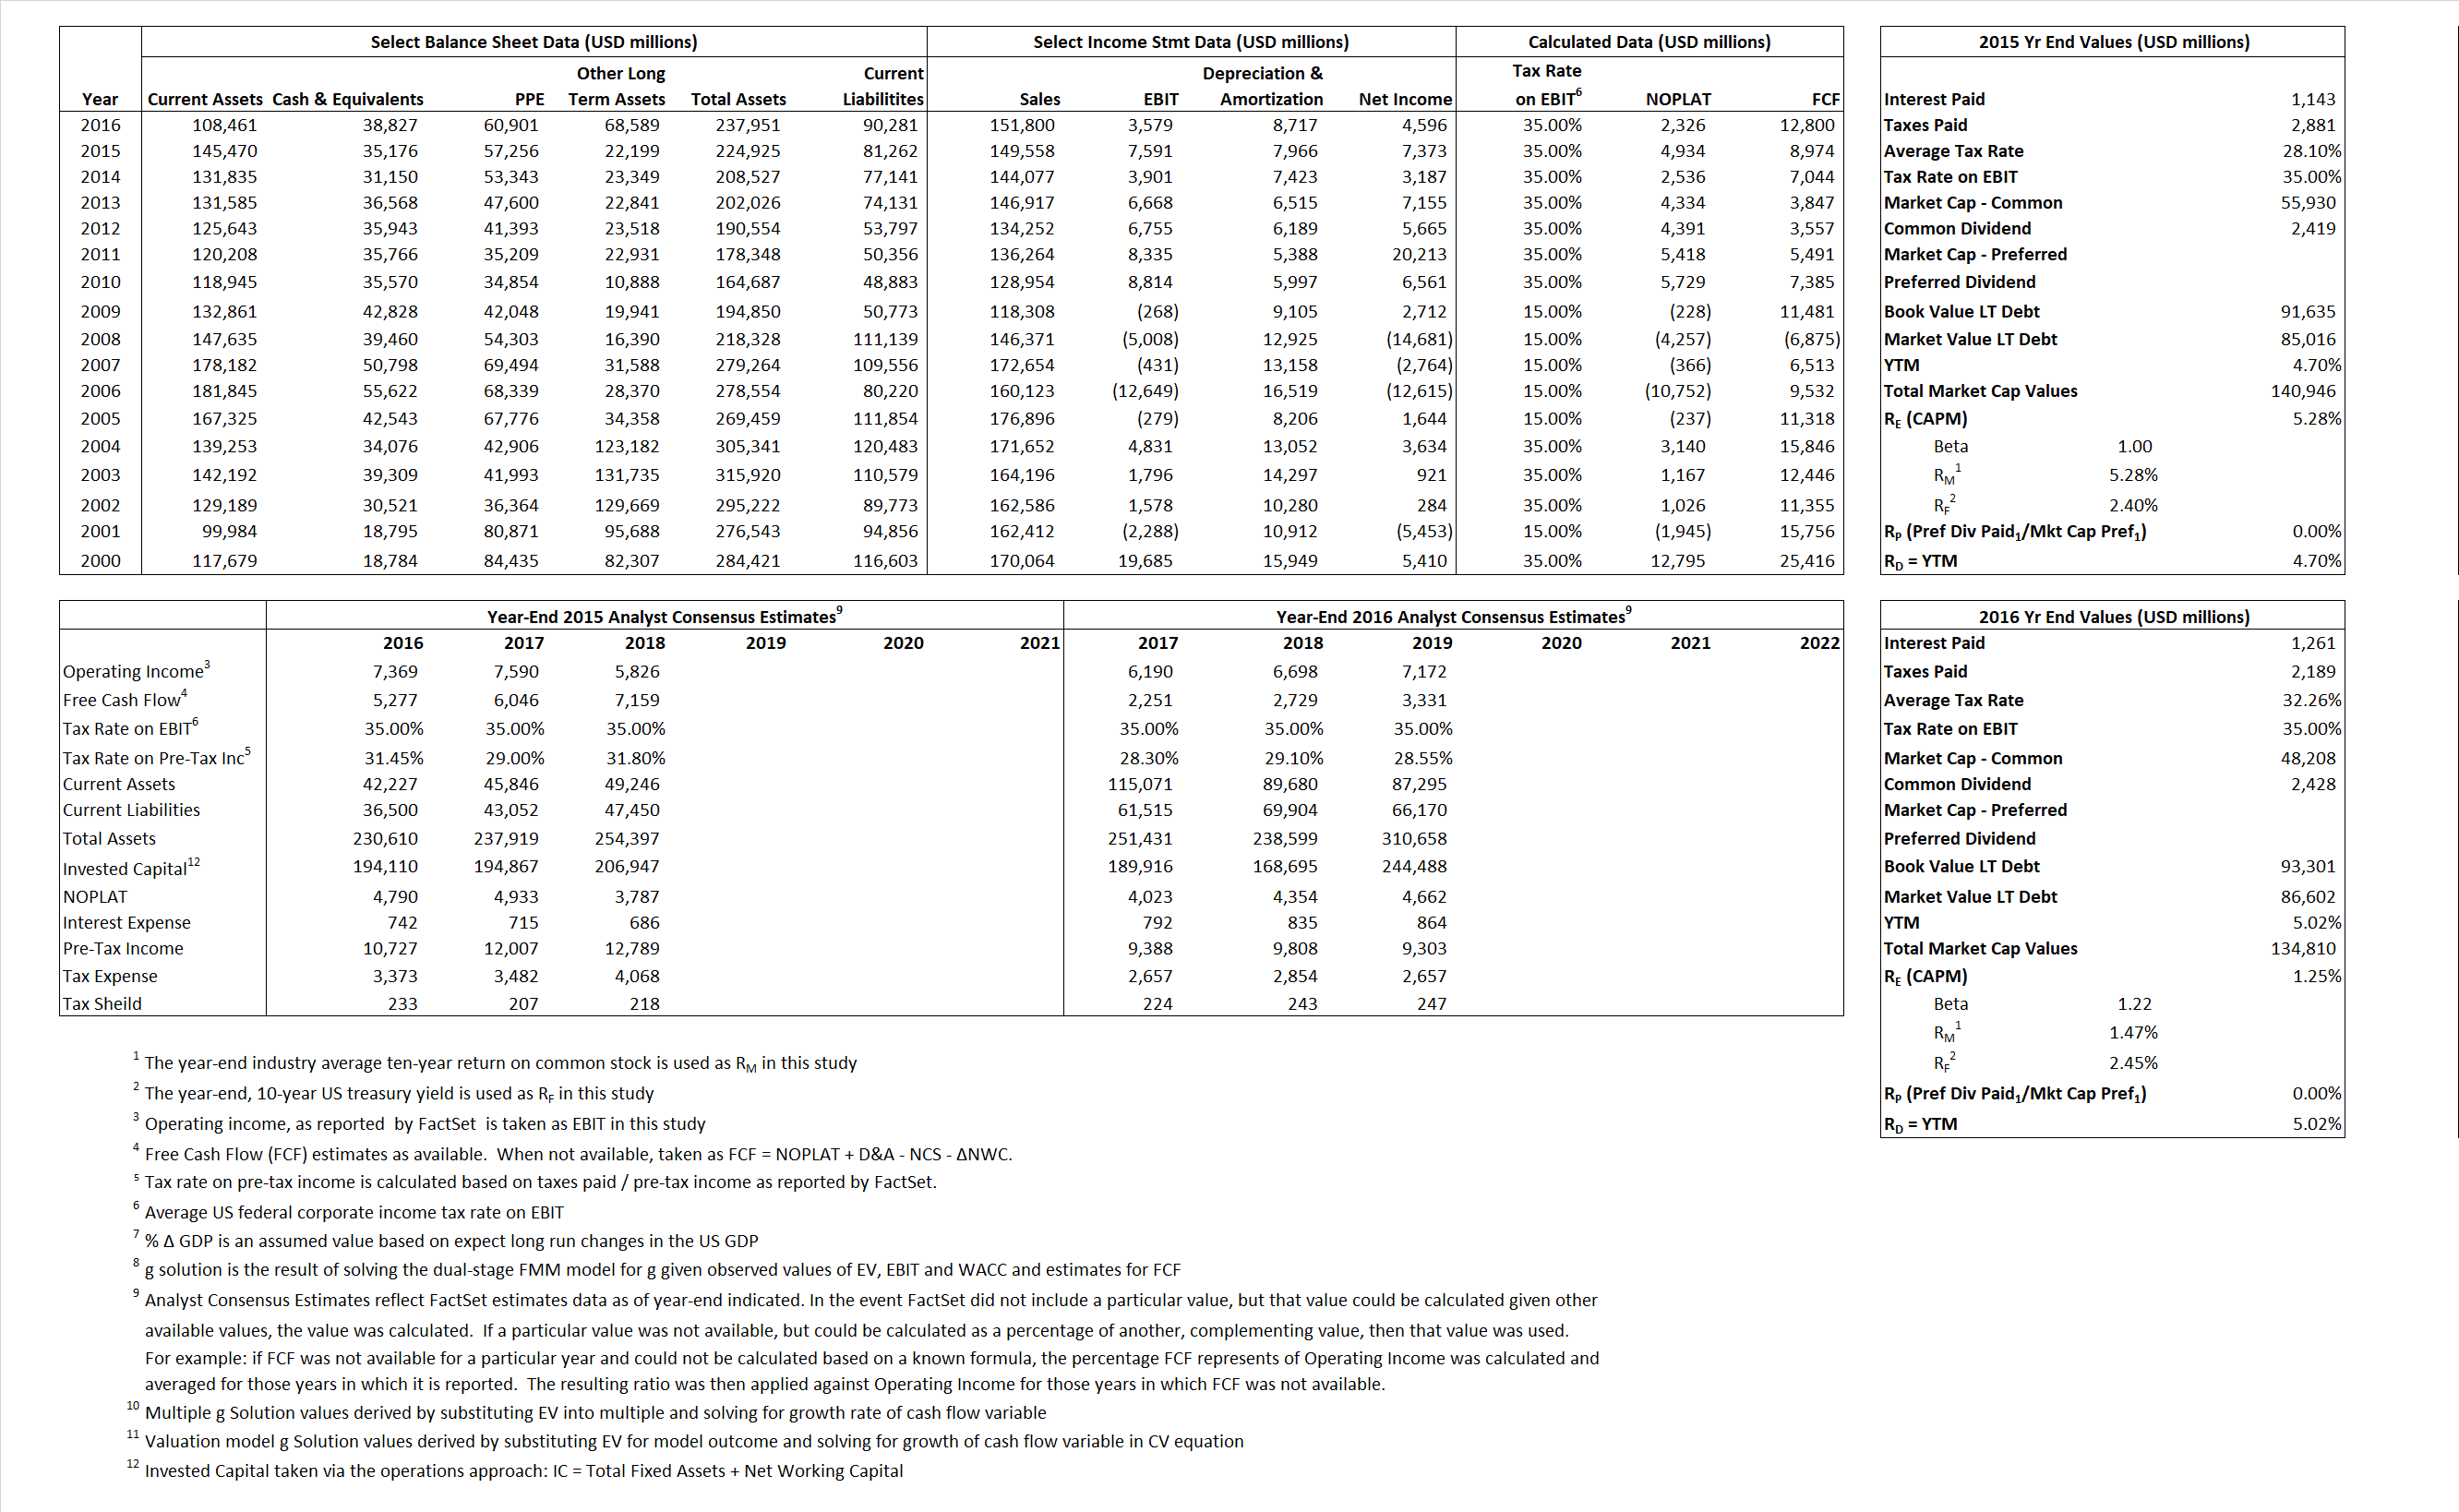
Primary Input Data
Derived Input Data
Derived Input |
Label |
2015 Value |
2016
|
Equational Form |
| Net Operating Profit Less Adjusted Taxes | NOPLAT | 4,934 | 2,326 |  |
| Free Cash Flow | FCF | 8,974 | 12,800 |  |
| Tax Shield | TS | 321 | 407 |  |
| Invested Capital | IC | 143,663 | 147,670 |  |
| Return on Invested Capital | ROIC | 3.43% | 1.58% |  |
| Net Investment | NetInv | 20,243 | 12,724 |  |
| Investment Rate | IR | 410.26% | 546.95% |  |
| Weighted Average Cost of Capital |
WACCMarket | 4.13% | 2.63% |  |
| WACCBook | 4.30% | 4.08% | ||
| Enterprise value |
EVMarket | 105,770 | 95,983 |  |
| EVBook | 112,389 | 102,682 | ||
| Long-Run Growth |
g = IR x ROIC |
14.09% | 8.62% | Long-run growth rates of the income variable are used in the Continuing Value portion of the valuation models. |
g = %  GDP GDP |
2.50% | 2.50% | ||
| Margin from Operations | M | 5.05% | 2.36% |  |
| Depreciation/Amortization Rate | D | 51.21% | 70.89% |  |
Valuation Multiple Outcomes
The outcomes presented in this study are the result of original input data, derived data, and synthesized inputs.
Equational Form |
Observed Value |
Single-stagemultiple g solution |
Two-stage valuationmodel g solution |
|||
| 12/31/2015 | 12/31/2016 | 12/31/2015 | 12/31/2016 | 12/31/2015 | 12/31/2016 | |
|
|
0.71 | 0.63 | 1.49% | -.39% | 1.82% | -0.92% |
|
|
6.80 | 7.81 | 1.49% | -.39% | 1.82% | -0.92% |
|
|
21.44 | 41.26 | 1.49% | -.39% | 1.82% | -0.92% |
|
|
11.79 | 7.50 | 1.49% | -.39% | 1.82% | -0.92% |
|
|
13.93 | 26.82 | 1.49% | -.39% | 1.82% | -0.92% |
|
|
0.74 | 0.65 | 1.49% | -.39% | 1.82% | -0.92% |


