Accenture
Analyst Listing
The following analysts provide coverage for the subject firm as of May 2016:
| Broker | Analyst | Analyst Email |
| Raymond James | Brian A. Gesuale | brian.gesuale@raymondjames.com |
| Cowen & Company | Bryan C. Bergin | bryan.bergin@cowen.com |
| Deutsche Bank Research | Bryan Keane | bryan.keane@db.com |
| Credit Suisse | Charles Brennan | charles.brennan@credit-suisse.com |
| RBC Capital Markets | Daniel Perlin | daniel.perlin@rbccm.com |
| Stifel Nicolaus | David Grossman | dgrossman@stifel.com |
| Evercore ISI | David Togut | david.togut@evercoreisi.com |
| Wells Fargo Securities | Edward S. Caso | edward.caso@wellsfargo.com |
| SunTrust Robinson Humphrey | Frank Atkins | frank.atkins@suntrust.com |
| Susquehanna Financial Group | James Friedman | james.friedman@sig.com |
| Jefferies | Jason Kupferberg | jkupferberg@jefferies.com |
| Cantor Fitzgerald | Joseph D. Foresi | jforesi@cantor.com |
| BMO Capital Markets | Keith Bachman | keith.bachman@bmo.com |
| Bernstein Research | Lisa D. Ellis | lisa.ellis@bernstein.com |
| CRT Capital Group | Moshe Katri | mkatri@sterneageecrt.com |
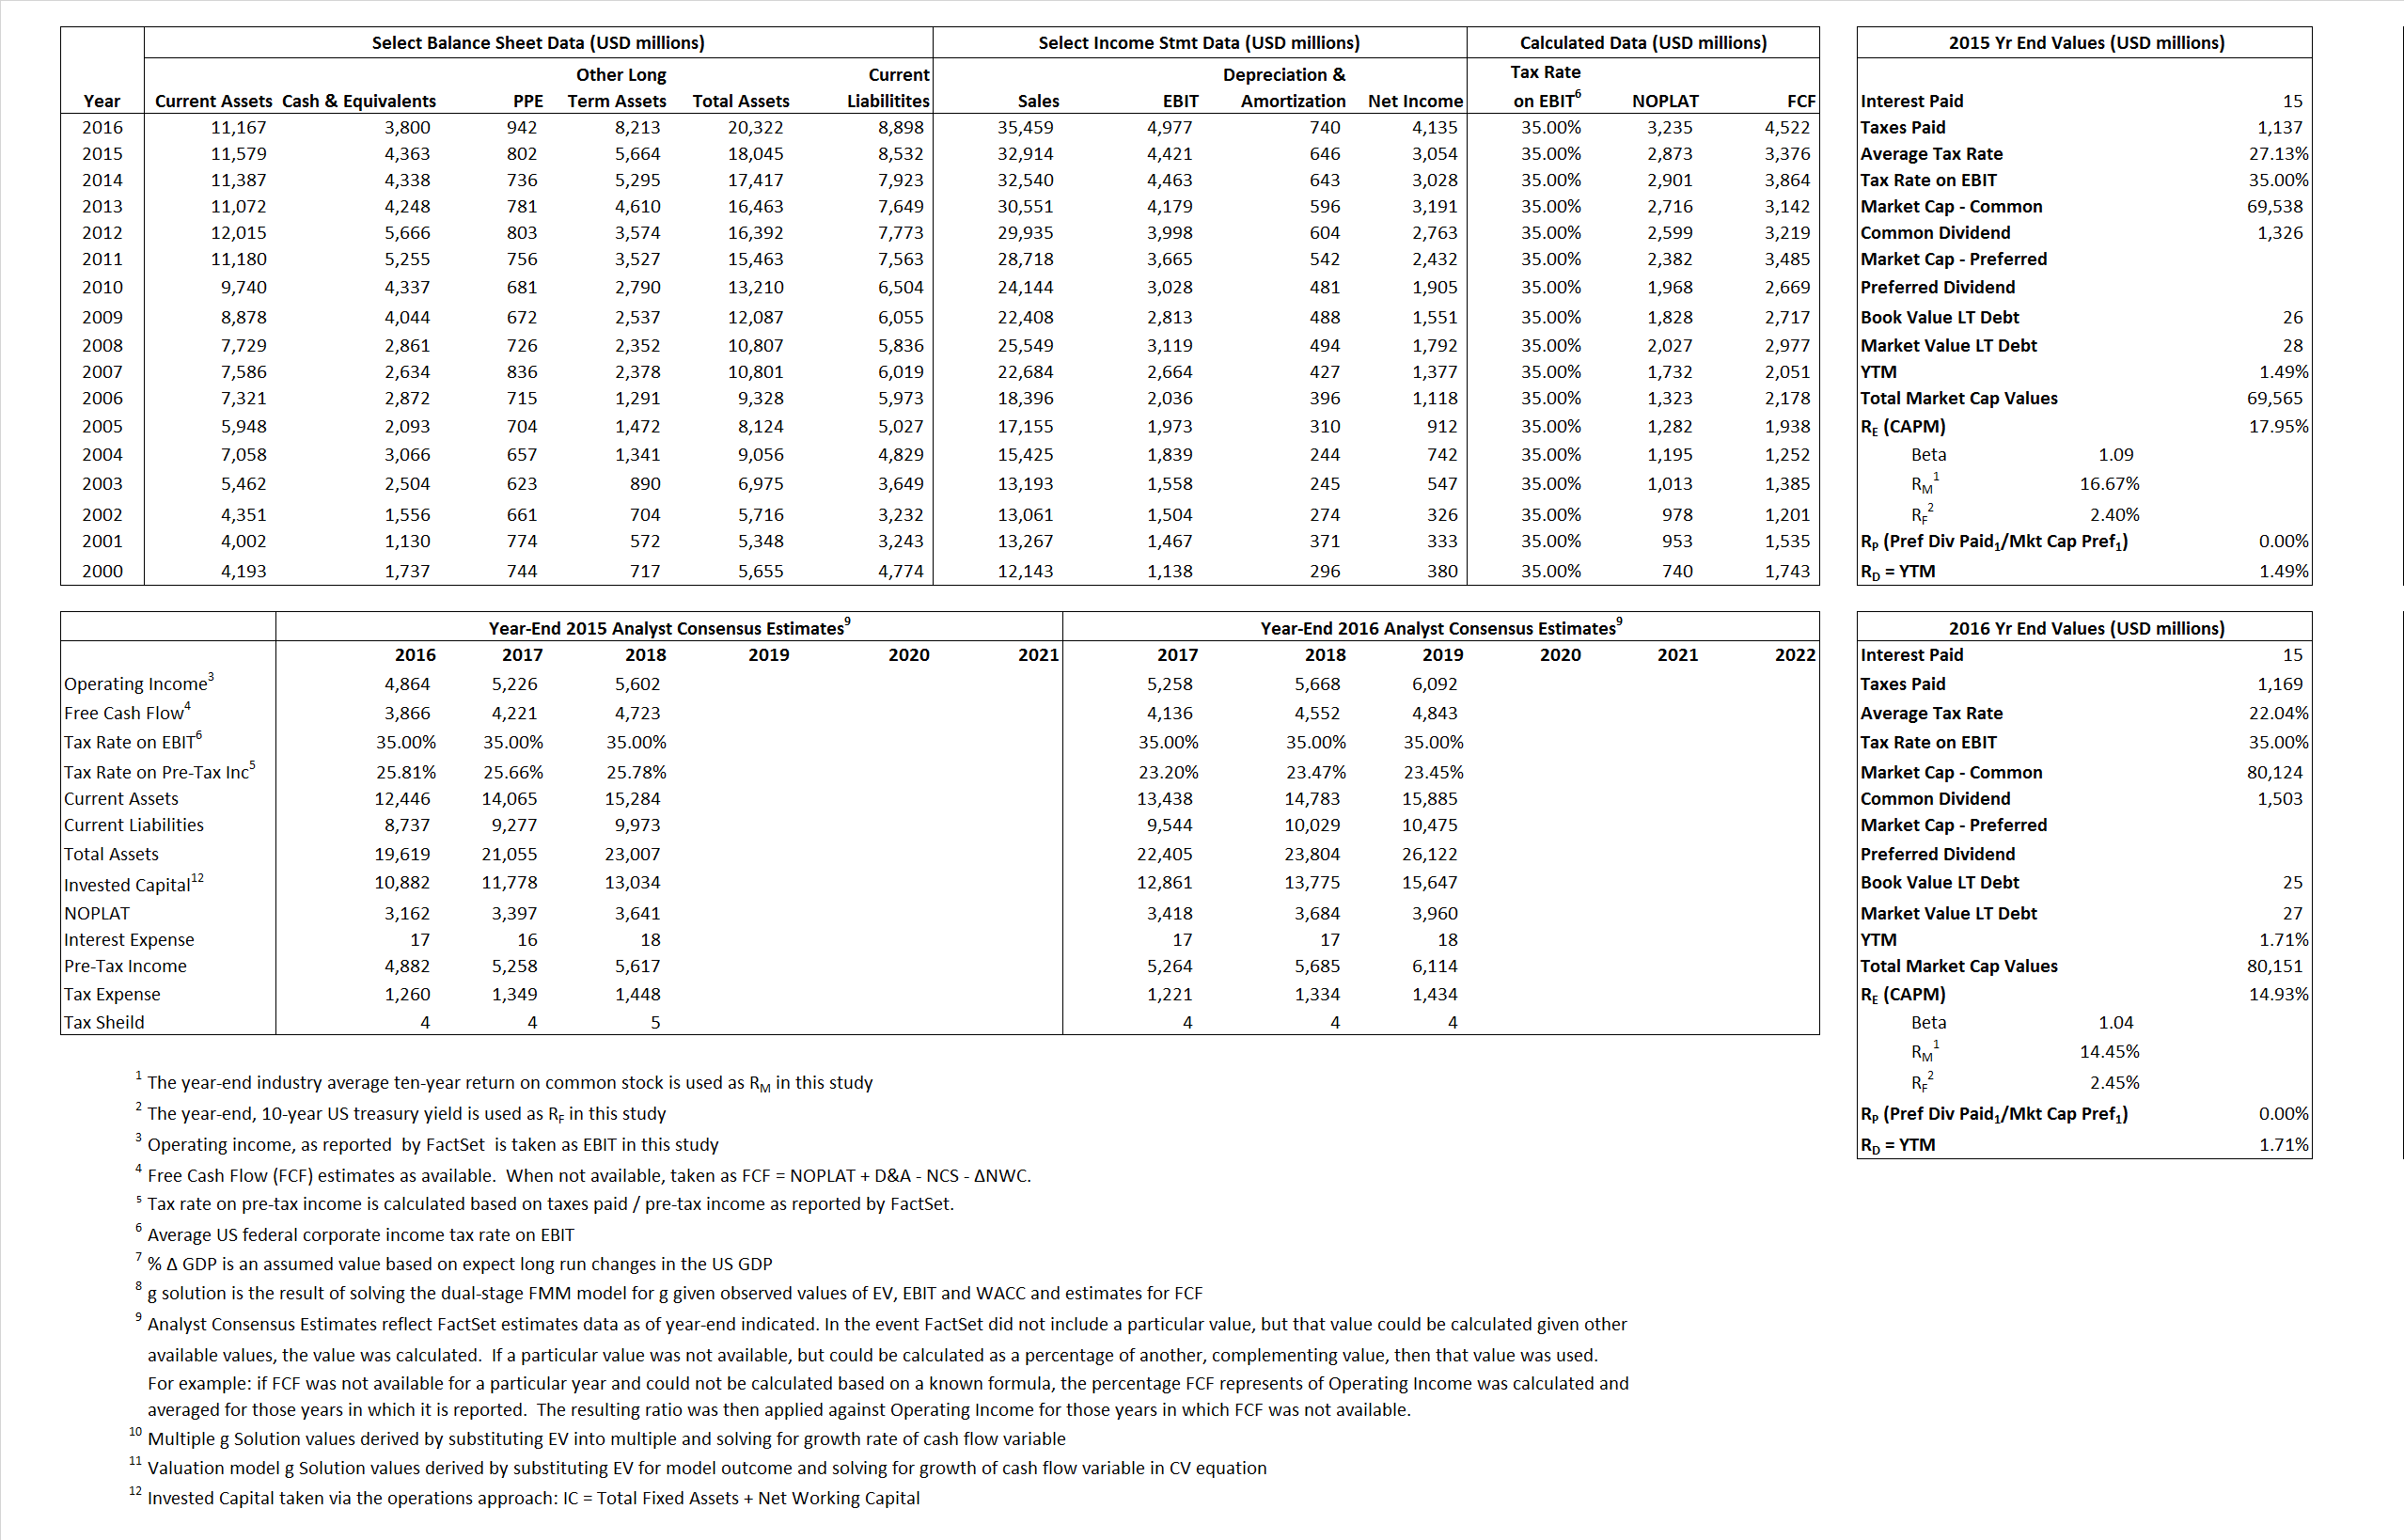
Primary Input Data
Derived Input Data
Derived Input |
Label |
2015 Value |
2016
|
Equational Form |
| Net Operating Profit Less Adjusted Taxes | NOPLAT | 2,873 | 3,235 |  |
| Free Cash Flow | FCF | 3,376 | 4,522 |  |
| Tax Shield | TS | 4 | 3 |  |
| Invested Capital | IC | 9,513 | 11,424 |  |
| Return on Invested Capital | ROIC | 30.21% | 28.32% |  |
| Net Investment | NetInv | 665 | 2,651 |  |
| Investment Rate | IR | 23.13% | 81.95% |  |
| Weighted Average Cost of Capital |
WACCMarket | 17.95% | 14.93% |  |
| WACCBook | 9.86% | 9.44% | ||
| Enterprise value |
EVMarket | 65,202 | 76,351 |  |
| EVBook | 65,200 | 76,349 | ||
| Long-Run Growth |
g = IR x ROIC |
6.99% | 23.21% | Long-run growth rates of the income variable are used in the Continuing Value portion of the valuation models. |
g = %  GDP GDP |
2.50% | 2.50% | ||
| Margin from Operations | M | 13.43% | 14.04% |  |
| Depreciation/Amortization Rate | D | 12.75% | 12.94% |  |
Valuation Multiple Outcomes
The outcomes presented in this study are the result of original input data, derived data, and synthesized inputs.
Equational Form |
Observed Value |
Single-stagemultiple g solution |
Two-stage valuationmodel g solution |
|||
| 12/31/2015 | 12/31/2016 | 12/31/2015 | 12/31/2016 | 12/31/2015 | 12/31/2016 | |
|
|
1.98 |
2.15 |
15.85% |
12.57% | 16.53% |
13.46% |
|
|
12.87 |
13.36 |
15.85% |
12.57% | 16.53% |
13.46% |
|
|
22.69 |
23.60 |
15.85% |
12.57% |
16.53% |
13.46% |
|
|
19.31 |
16.89 |
15.85% |
12.57% |
16.53% |
13.46% |
|
|
14.75 |
15.34 |
15.85% |
12.57% |
16.53% |
13.46% |
|
|
6.85 |
6.68 |
15.85% |
12.57% |
16.53% |
13.46% |


