Nike
Analyst Listing
The following analysts provide coverage for the subject firm as of May 2016:
| Broker | Analyst | Analyst Email |
| DA Davidson | Andrew Burns | aburns@dadco.com |
| Canaccord Genuity | Camilo Lyon | clyon@canaccordgenuity.com |
| Credit Suisse | Christian Buss | christian.buss@credit-suisse.com |
| Susquehanna Financial Group | Christopher Svezia | christopher.svezia@sig.com |
| BB&T Capital Markets | Corinna L. Freedman | cfreedman@bbandtcm.com |
| Jefferies | Edward Plank | eplank@jefferies.com |
| Brean Capital, LLC | Eric B. Tracy | etracy@breancapital.com |
| Piper Jaffray | Erinn E. Murphy | erinn.e.murphy@pjc.com |
| Hilliard Lyons | Jeffrey S. Thomison | jthomison@hilliard.com |
| Stifel Nicolaus | Jim Duffy | jduffy@stifel.com |
| Cowen & Company | John Kernan | john.kernan@cowen.com |
| Telsey Advisory Group | Kelly Chen | kchen@telseygroup.com |
| B Riley & Co | Mitch Kummetz | mkummetz@brileyco.com |
| Evercore ISI | Omar Saad | omar.saad@evercoreisi.com |
| Nomura Research | Robert S. Drbul | robert.drbul@nomura.com |
| CRT Capital Group | Sam Poser | sposer@sterneageecrt.com |
| Buckingham Research | Scott Krasik | skrasik@buckresearch.com |
| FBR Capital Markets & Co | Susan Anderson | sanderson@fbr.com |
| Wells Fargo Securities | Tom Nikic | tom.nikic@wellsfargo.com |
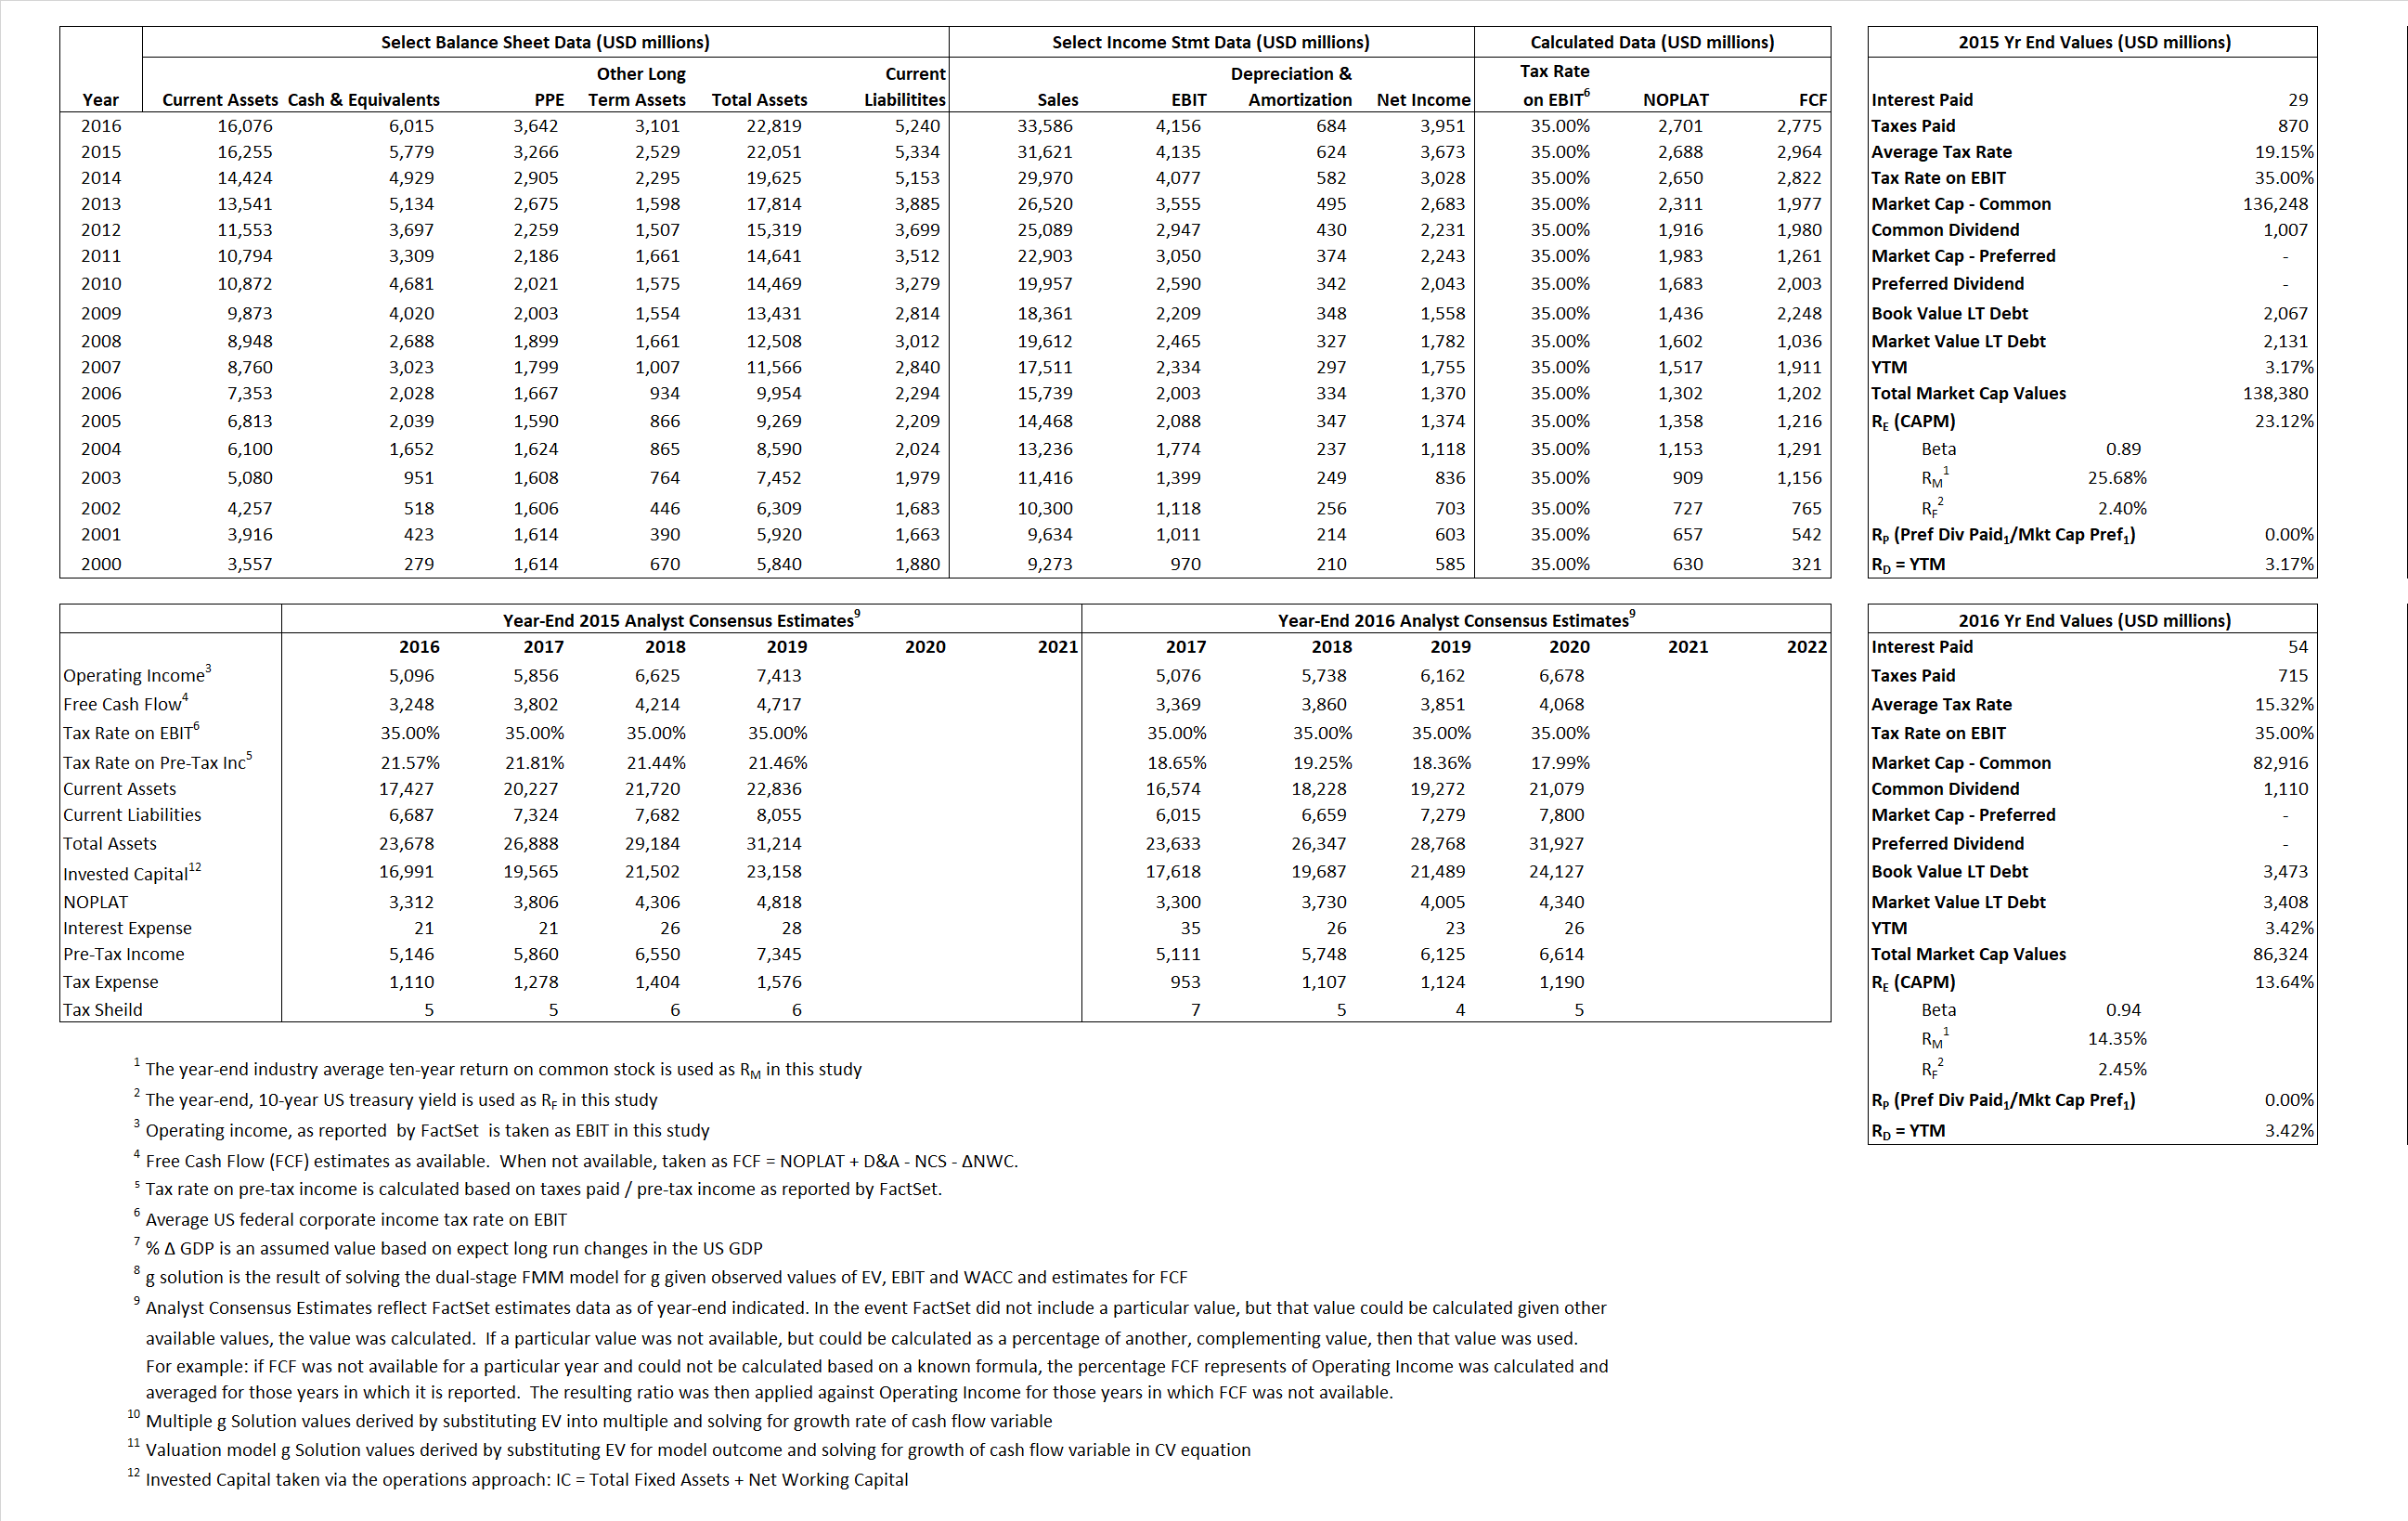
Primary Input Data
Derived Input Data
Derived Input |
Label |
2015 Value |
2016
|
Equational Form |
| Net Operating Profit Less Adjusted Taxes | NOPLAT | 2,688 | 2,701 |  |
| Free Cash Flow | FCF | 2,964 | 2,775 |  |
| Tax Shield | TS | 6 | 8 |  |
| Invested Capital | IC | 16,717 | 17,578 |  |
| Return on Invested Capital | ROIC | 16.08% | 15.37% |  |
| Net Investment | NetInv | 2,869 | 1,545 |  |
| Investment Rate | IR | 106.75% | 57.20% |  |
| Weighted Average Cost of Capital |
WACCMarket | 22.80% | 13.21% |  |
| WACCBook | 8.52% | 8.86% | ||
| Enterprise value |
EVMarket | 132,600 | 80,309 |  |
| EVBook | 132,300 | 80,374 | ||
| Long-Run Growth |
g = IR x ROIC |
17.16% | 8.79% | Long-run growth rates of the income variable are used in the Continuing Value portion of the valuation models. |
g = %  GDP GDP |
2.50% | 2.50% | ||
| Margin from Operations | M | 13.08% | 12.37% |  |
| Depreciation/Amortization Rate | D | 13.11% | 14.13% |  |
Valuation Multiple Outcomes
The outcomes presented in this study are the result of original input data, derived data, and synthesized inputs.
Equational Form |
Observed Value |
Single-stagemultiple g solution |
Two-stage valuationmodel g solution |
|||
| 12/31/2015 | 12/31/2016 | 12/31/2015 | 12/31/2016 | 12/31/2015 | 12/31/2016 | |
|
|
4.19 | 2.39 | 23.77% | 12.61% | 23.23% | 12.88% |
|
|
27.86 | 16.59 | 23.77% | 12.61% | 23.23% | 12.88% |
|
|
49.33 | 29.73 | 23.77% | 12.61% | 23.23% | 12.88% |
|
|
44.73 | 28.94 | 23.77% | 12.61% | 23.23% | 12.88% |
|
|
32.07 | 19.33 | 23.77% | 12.61% | 23.23% | 12.88% |
|
|
7.93 | 4.57 | 23.77% | 12.61% | 23.23% | 12.88% |


