Occidental Petroleum Corp.
Analyst Listing
The following analysts provide coverage for the subject firm as of May 2016:
| Broker | Analyst | Analyst Email |
| Atlantic Equities | Barry MacCarthy | b.maccarthy@atlantic-equities.com |
| Cowen & Company | Charles Robertson | charles.robertson@cowen.com |
| Evercore ISI | Douglas Terreson | doug.terreson@evercoreisi.com |
| Credit Suisse | Edward Westlake | edward.westlake@credit-suisse.com |
| IBERIA Capital Partners | Eric Fox | eric.fox@iberiabank.com |
| Piper Jaffray | Guy Baber | roger.read@wellsfargo.com |
| Jefferies | Jason Gammel | jason.gammel@jefferies.com |
| Tudor Pickering Holt & Co. | Matthew Portillo | mportillo@tphco.com |
| Wolfe Research | Paul Sankey | psankey@wolferesearch.com |
| Raymond James | Pavel Molchanov | pavel.molchanov@raymondjames.com |
| Scotia Howard Weil | Peter Kissel | peter.kissel@scotiabank.com |
| BMO Capital Markets | Phillip Jungwirth | phillip.jungwirth@bmo.com |
| Capital One Securities | Richard Tullis | richard.tullis@capitalone.com |
| GMP Securities | Robert Bakanauskas | bbakan@gmpsecurities.com |
| Wells Fargo Securities | Roger D. Read | roger.read@wellsfargo.com |
| Deutsche Bank Research | Ryan Todd | ryan.todd@db.com |
| CRT Capital Group | Tim Rezvan | trezvan@sterneageecrt.com |
Primary Input Data
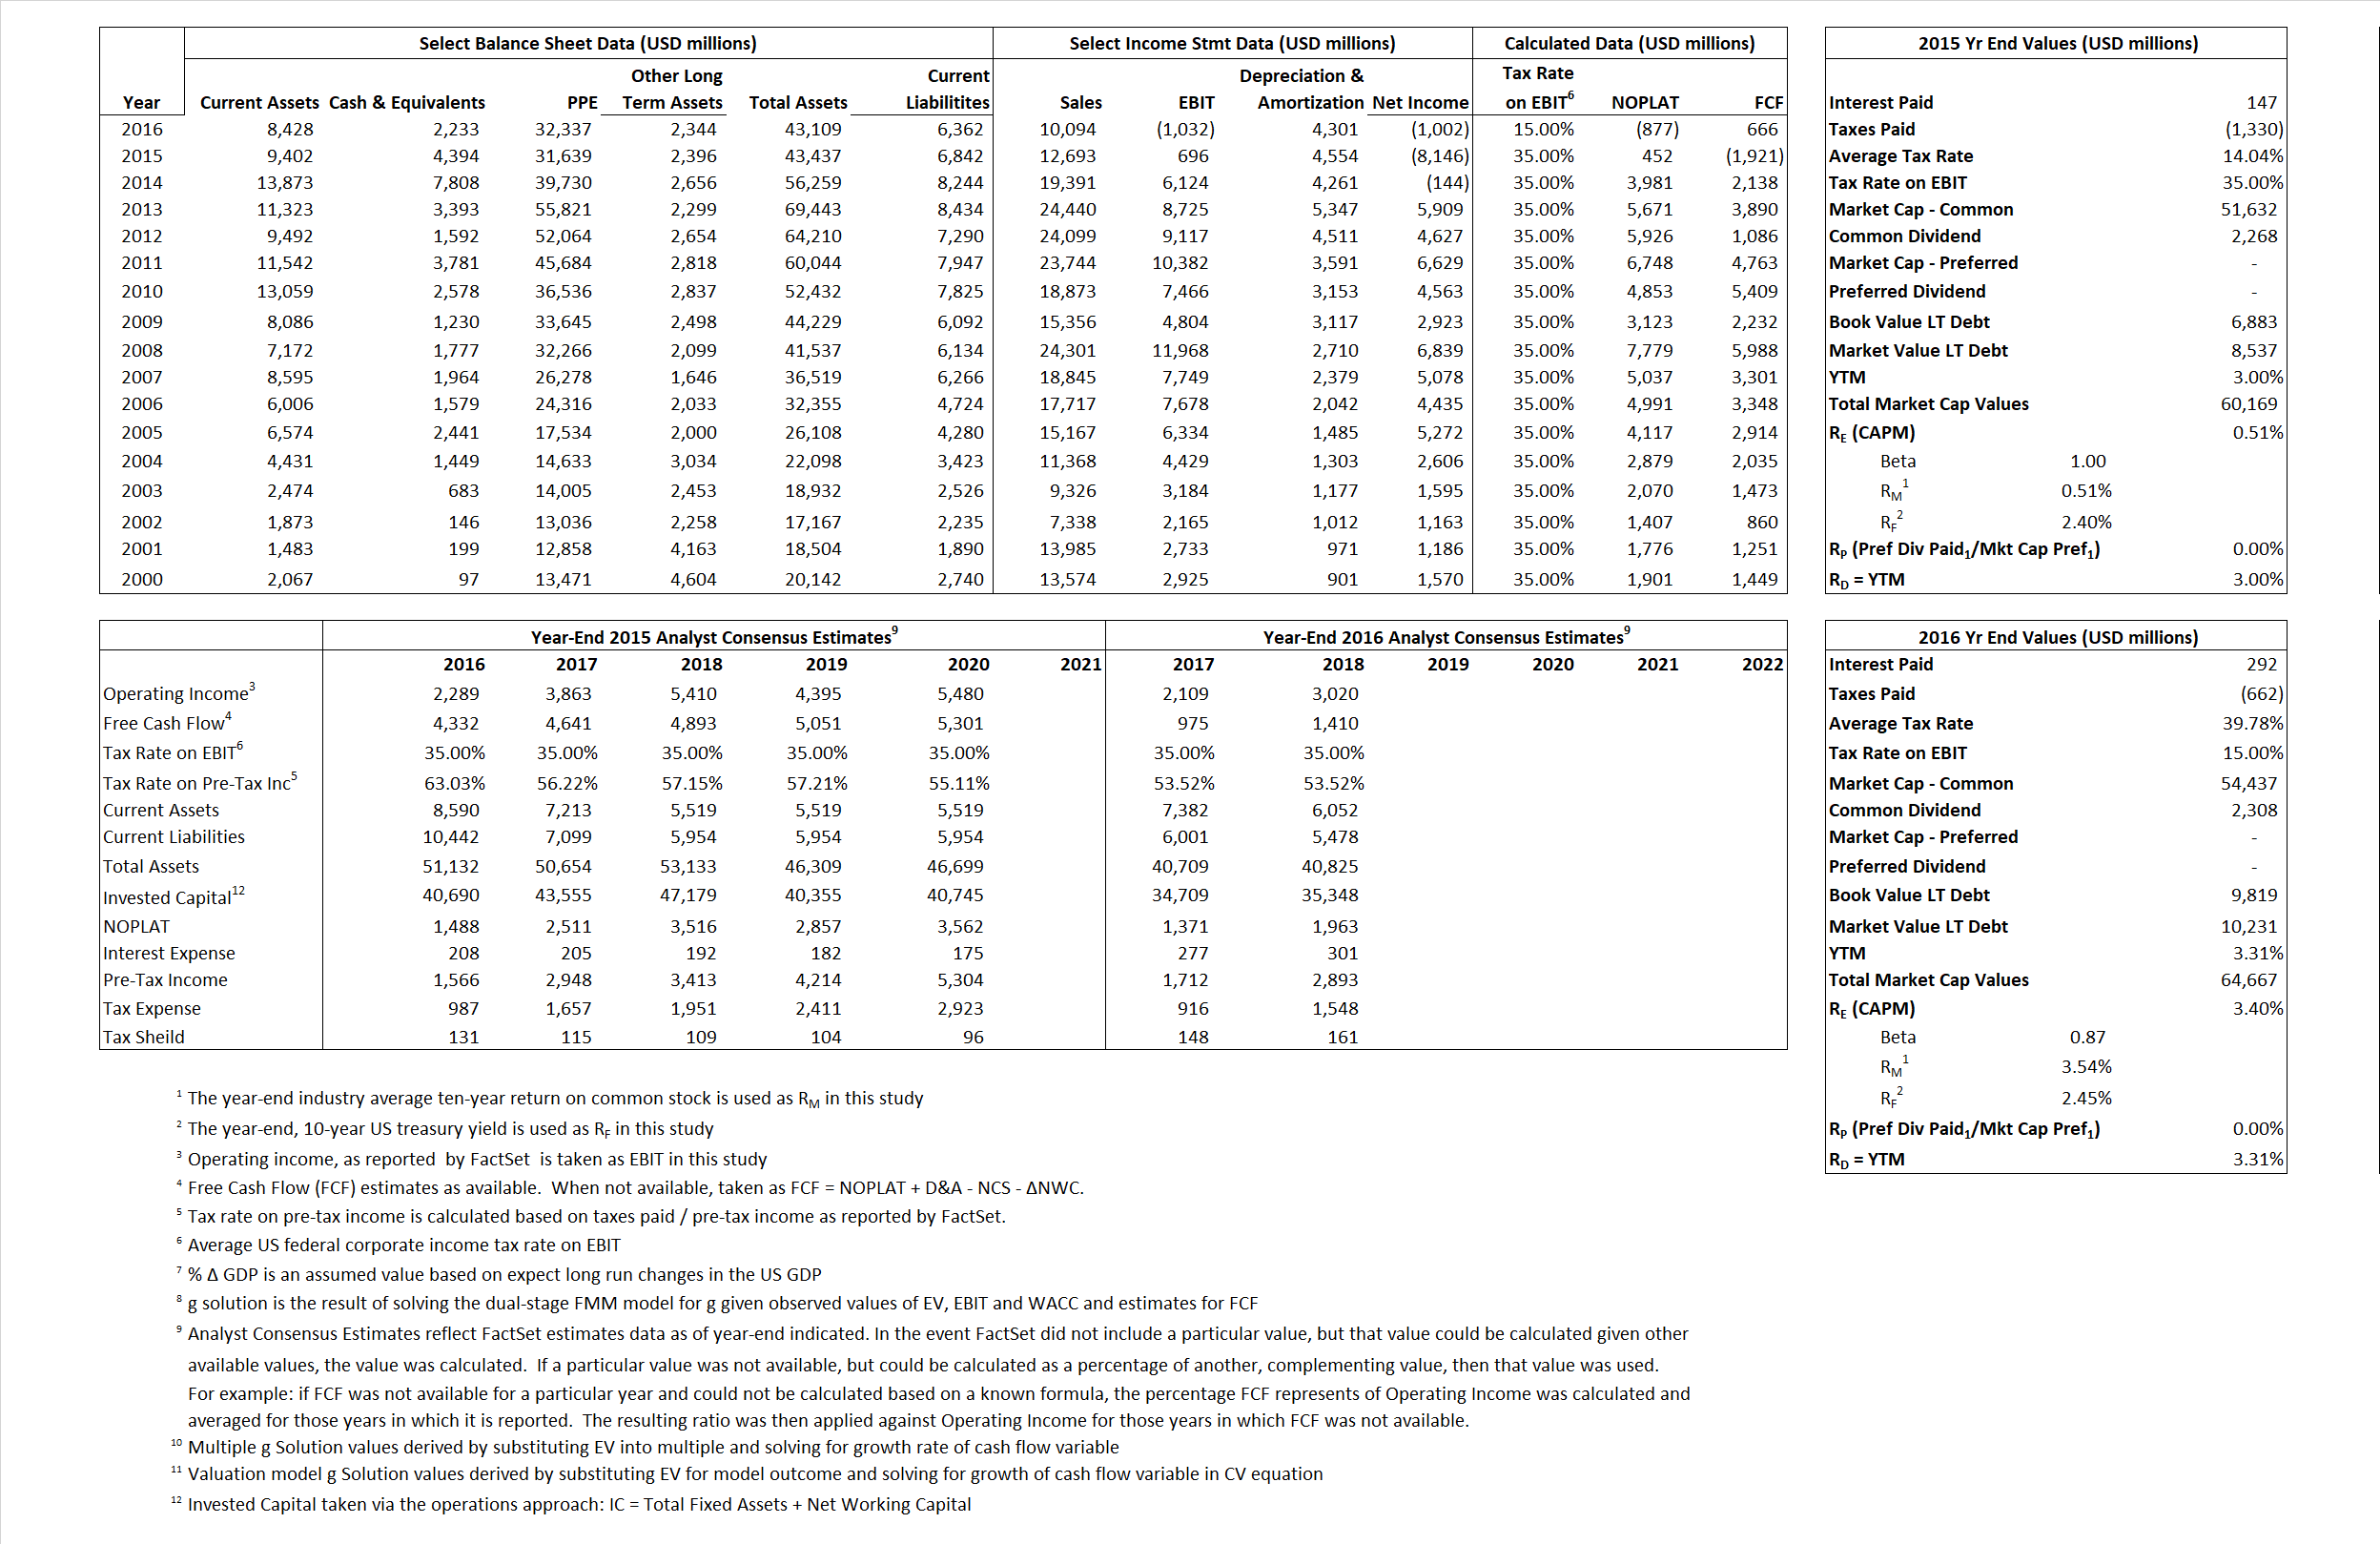
Derived Input Data
Derived Input |
Label |
2015 Value |
2016
|
Equational Form |
| Net Operating Profit Less Adjusted Taxes | NOPLAT | 452 | (877) |  |
| Free Cash Flow | FCF | (1,921) | 666 |  |
| Tax Shield | TS | 21 | 116 |  |
| Invested Capital | IC | 36,595 | 36,747 |  |
| Return on Invested Capital | ROIC | 1.24% | -2.39% |  |
| Net Investment | NetInv | (6,866) | 4,453 |  |
| Investment Rate | IR | -1,517.68% | -507.64% |  |
| Weighted Average Cost of Capital |
WACCMarket | 0.80% | 3.18% |  |
| WACCBook | 8.46% | 6.57% | ||
| Enterprise value |
EVMarket | 55,775 | 62,434 |  |
| EVBook | 56,282 | 62,023 | ||
| Long-Run Growth |
g = IR x ROIC |
-18.76% | 12.12% | Long-run growth rates of the income variable are used in the Continuing Value portion of the valuation models. |
g = %  GDP GDP |
2.50% | 2.50% | ||
| Margin from Operations | M | 5.48% | -10.22% |  |
| Depreciation/Amortization Rate | D | 86.74% | 131.57% |  |
Valuation Multiple Outcomes
The outcomes presented in this study are the result of original input data, derived data, and synthesized inputs.
Equational Form |
Observed Value |
Single-stagemultiple g solution |
Two-stage valuationmodel g solution |
|||
| 12/31/2015 | 12/31/2016 | 12/31/2015 | 12/31/2016 | 12/31/2015 | 12/31/2016 | |
|
|
4.39 | 6.19 | -.02% | 11.13% | 5.86% | 10.06% |
|
|
10.62 | 19.10 | -.02% | 11.13% | 5.86% | 10.06% |
|
|
123.29 | -71.17 | -.02% | 11.13% | 5.86% | 10.06% |
|
|
-29.03 | 93.75 | -.02% | 11.13% | 5.86% | 10.06% |
|
|
80.14 | -60.50 | -.02% | 11.13% | 5.86% | 10.06% |
|
|
1.52 | 1.70 | -.02% | 11.13% | 5.86% | 10.06% |


