Priceline Group
Analyst Listing
The following analysts provide coverage for the subject firm as of May 2016:
Primary Input Data
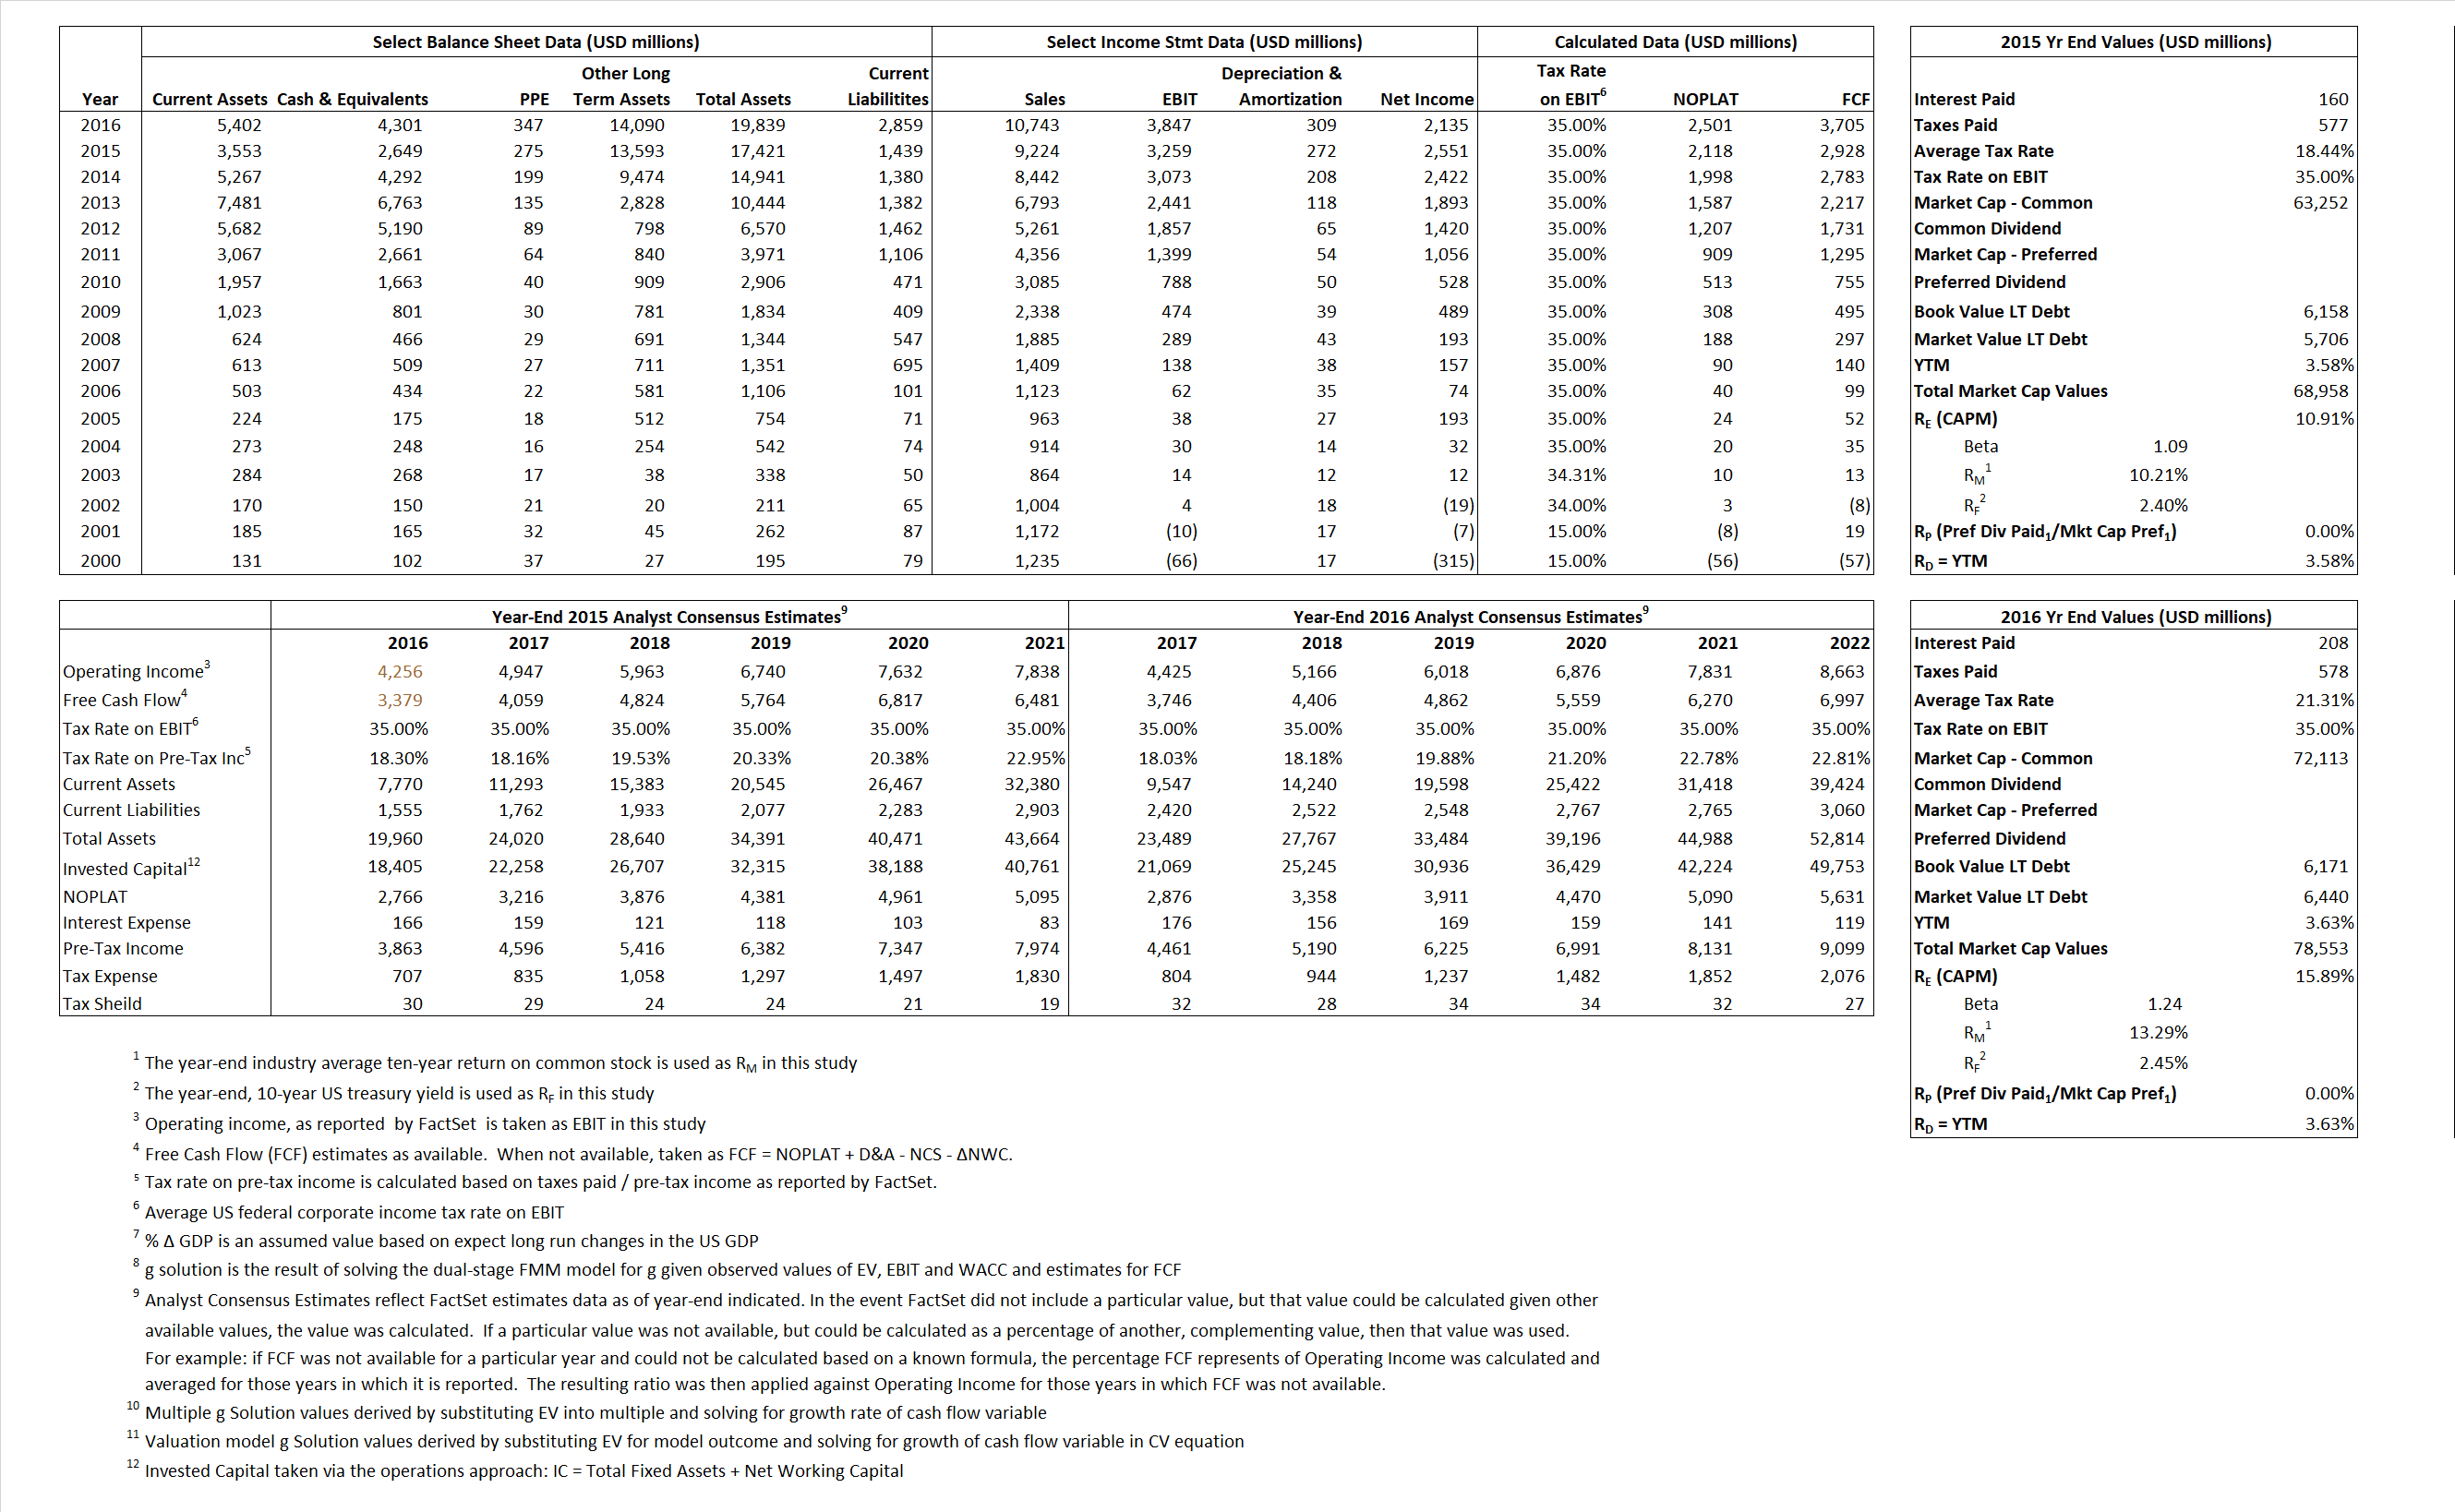
Derived Input Data
Derived Input |
Label |
2015 Value |
2016
|
Equational Form |
| Net Operating Profit Less Adjusted Taxes | NOPLAT | 2,118 | 2,501 |  |
| Free Cash Flow | FCF | 2,928 | 3,705 |  |
| Tax Shield | TS | 30 | 44 |  |
| Invested Capital | IC | 15,981 | 16,980 |  |
| Return on Invested Capital | ROIC | 13.25% | 14.73% |  |
| Net Investment | NetInv | 2,693 | 1,308 |  |
| Investment Rate | IR | 127.14% | 52.32% |  |
| Weighted Average Cost of Capital |
WACCMarket | 10.25% | 14.82% |  |
| WACCBook | 9.37% | 9.84% | ||
| Enterprise value |
EVMarket | 66,309 | 74,253 |  |
| EVBook | 65,110 | 73,983 | ||
| Long-Run Growth |
g = IR x ROIC |
16.85% | 7.70% | Long-run growth rates of the income variable are used in the Continuing Value portion of the valuation models. |
g = %  GDP GDP |
2.50% | 2.50% | ||
| Margin from Operations | M | 35.33% | 35.81% |  |
| Depreciation/Amortization Rate | D | 7.72% | 7.44% |  |
Valuation Multiple Outcomes
The outcomes presented in this study are the result of original input data, derived data, and synthesized inputs.
Equational Form |
Observed Value |
Single-stagemultiple g solution |
Two-stage valuationmodel g solution |
|||
| 12/31/2015 | 12/31/2016 | 12/31/2015 | 12/31/2016 | 12/31/2015 | 12/31/2016 | |
|
|
7.19 | 6.91 | 9.30% | 14.85% | 9.48% | 14.84% |
|
|
18.78 | 17.87 | 9.30% | 14.85% | 9.48% | 14.84% |
|
|
31.30 | 29.69 | 9.30% | 14.85% | 9.48% | 14.84% |
|
|
22.64 | 20.04 | 9.30% | 14.85% | 9.48% | 14.84% |
|
|
20.35 | 19.30 | 9.30% | 14.85% | 9.48% | 14.84% |
|
|
4.15 | 4.37 | 9.30% | 14.85% | 9.48% | 14.84% |


