Walgreens Boots Alliance
Analyst Listing
The following analysts provide coverage for the subject firm as of May 2016:
| Broker | Analyst | Analyst Email |
| BB&T Capitial Markets | Andrew P. Wolf | awolf@bbandtcm.com |
| Mizuho Securities USA | Ann Hynes | ann.hynes@us.mizuho-sc.com |
| Cowen & Company | Charles Rhyee | charles.rhyee@cowen.com |
| Leerink Partners | David Larsen | david.larsen@leerink.com |
| SunTrust Robinson Humphrey | David S. MacDonald | david.macdonald@suntrust.com |
| Deutsche Bank Research | George Hill | george.hill@db.com |
| Guggenheim Securities | John Heinbockel | john.heinbockel@guggenheimpartners.com |
| Raymond James | John W. Ransom | john.ransom@raymondjames.com |
| Jefferies | Mark Wiltamuth | mwiltamuth@jefferies.com |
| Scotiabank GBM | Patricia A. Baker | patricia.baker@scotiabank.com |
| Credit Suisse | Robert M. Willoughby | robert.willoughby@credit-suisse.com |
| Atlantic Equities | Sam Hudson | s.hudson@atlantic-equities.com |
| Wolfe Research | Scott Mushkin | smushkin@wolferesearch.com |
| FBR Capital Markets | Steven Halper | shalper@fbr.com |
Primary Input Data
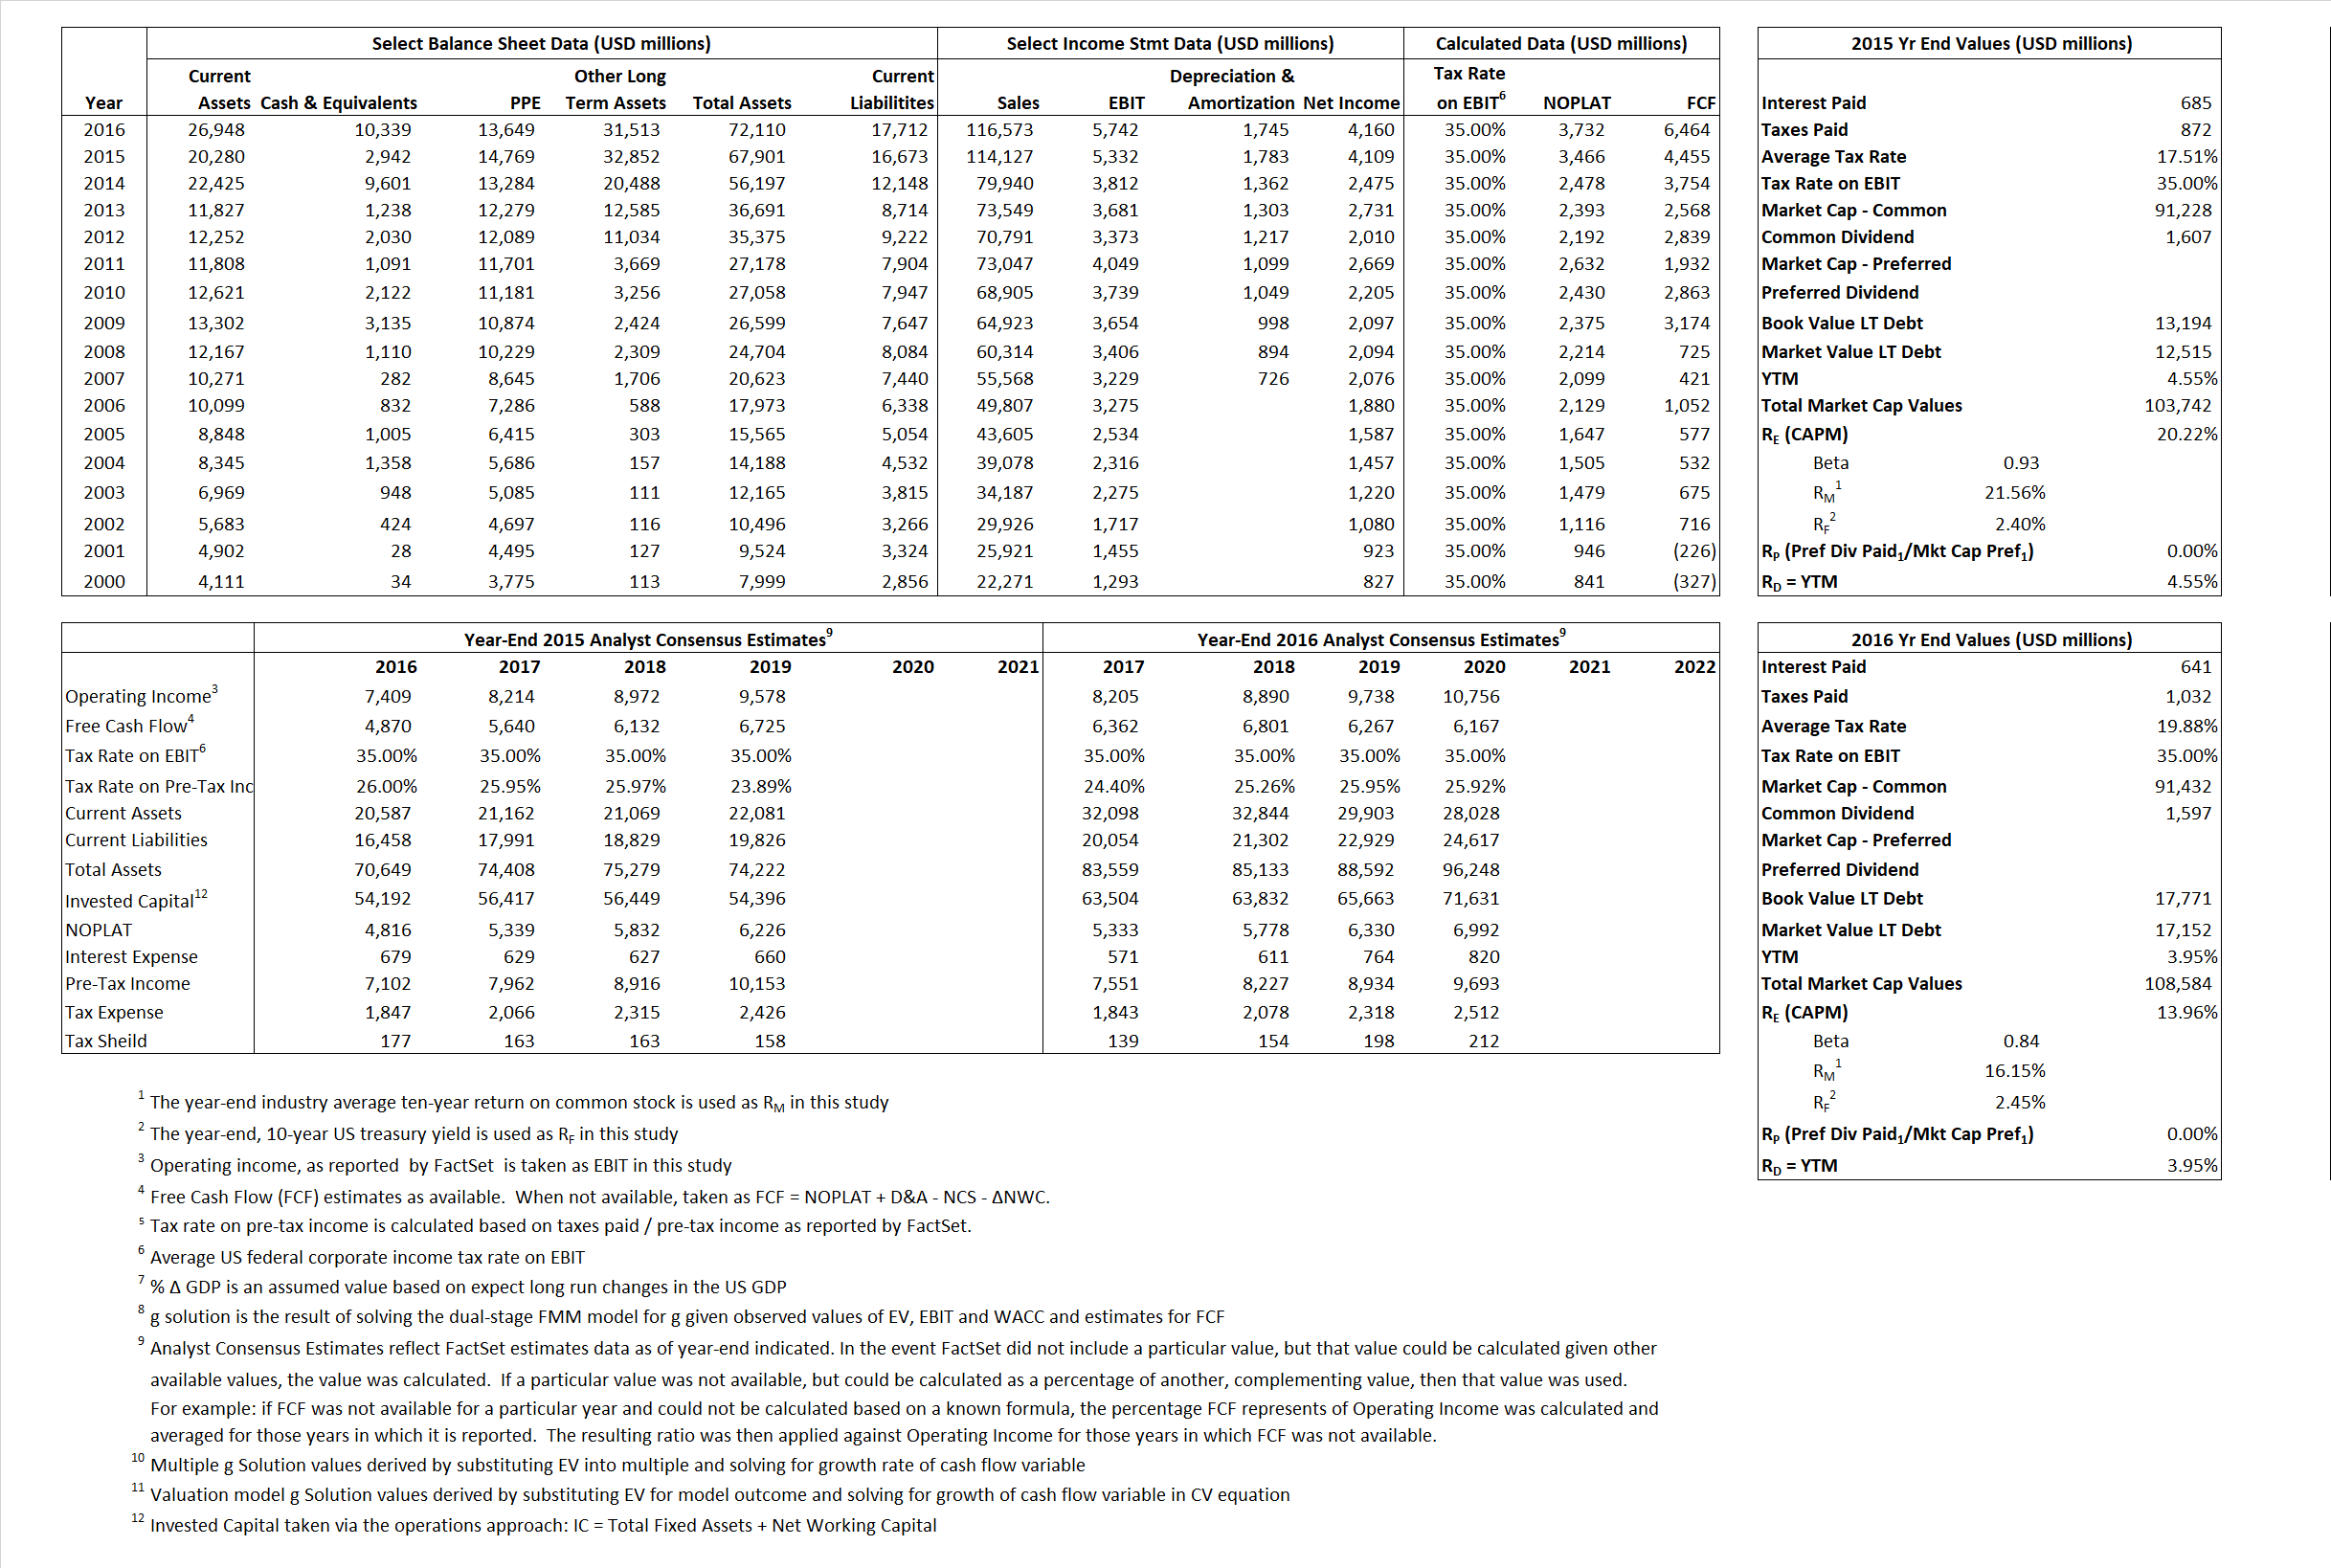
Derived Input Data
Derived Input |
Label |
2015 Value |
2016
|
Equational Form |
| Net Operating Profit Less Adjusted Taxes | NOPLAT | 3,466 | 3,732 |  |
| Free Cash Flow | FCF | 4,455 | 6,464 |  |
| Tax Shield | TS | 120 | 127 |  |
| Invested Capital | IC | 51,228 | 54,398 |  |
| Return on Invested Capital | ROIC | 6.77% | 6.86% |  |
| Net Investment | NetInv | 8,962 | 4,915 |  |
| Investment Rate | IR | 258.60% | 131.69% |  |
| Weighted Average Cost of Capital |
WACCMarket | 18.23% | 12.25% |  |
| WACCBook | 7.63% | 7.09% | ||
| Enterprise value |
EVMarket | 100,800 | 98,244 |  |
| EVBook | 94,082 | 98,864 | ||
| Long-Run Growth |
g = IR x ROIC |
17.49% | 9.04% | Long-run growth rates of the income variable are used in the Continuing Value portion of the valuation models. |
g = %  GDP GDP |
2.50% | 2.50% | ||
| Margin from Operations | M | 4.67% | 4.93% |  |
| Depreciation/Amortization Rate | D | 25.06% | 23.31% |  |
Valuation Multiple Outcomes
The outcomes presented in this study are the result of original input data, derived data, and synthesized inputs.
Equational Form |
Observed Value |
Single-stagemultiple g solution |
Two-stage valuationmodel g solution |
|||
| 12/31/2015 | 12/31/2016 | 12/31/2015 | 12/31/2016 | 12/31/2015 | 12/31/2016 | |
|
|
0.88 | 0.84 | 30.08% | 18.94% | 23.30% | 15.14% |
|
|
14.17 | 13.12 | 30.08% | 18.94% | 23.30% | 15.14% |
|
|
29.09 | 26.32 | 30.08% | 18.94% | 23.30% | 15.14% |
|
|
22.63 | 15.20 | 30.08% | 18.94% | 23.30% | 15.14% |
|
|
18.91 | 17.11 | 30.08% | 18.94% | 23.30% | 15.14% |
|
|
1.97 | 1.81 | 30.08% | 18.94% | 23.30% | 15.14% |


