Lowe’s Companies, Inc.
Analyst Listing
The following analysts provide coverage for the subject firm as of May 2016:
| Broker | Analyst | Analyst Email |
| Oppenheimer | Brian Nagel | brian.nagel@opco.com |
| Raymond James | Budd Bugatch | budd.bugatch@raymondjames.com |
| Jefferies | Daniel Binder | dbinder@jefferies.com |
| Consumer Edge Research | David A. Schick | dschick@consumeredgeresearch.com |
| Longbow Research | David S. MacGregor | dmacgregor@longbowresearch.com |
| Evercore ISI | Greg Melich | greg.melich@evercoreisi.com |
| Nomura Research | Jessica A. Schoen | jessica.schoen@nomura.com |
| Telsey Advisory Group | Joseph Feldman | jfeldman@telseygroup.com |
| SunTrust Robinson Humphrey | Keith Hughes | keith.hughes@suntrust.com |
| Deutsche Bank Research | Mike Baker | michael.baker@db.com |
| Piper Jaffray | Peter J. Keith | peter.j.keith@pjc.com |
| Atlantic Equities | Sam Hudson | s.hudson@atlantic-equities.com |
| RBC Capital Markets | Scot Ciccarelli | scot.ciccarelli@rbccm.com |
| Wolfe Research | Scott Mushkin | smushkin@wolferesearch.com |
| Wedbush Securities | Seth Basham | seth.basham@wedbush.com |
| BMO Capital Markets | Wayne Hood | wayne.hood@bmo.com |
Primary Input Data
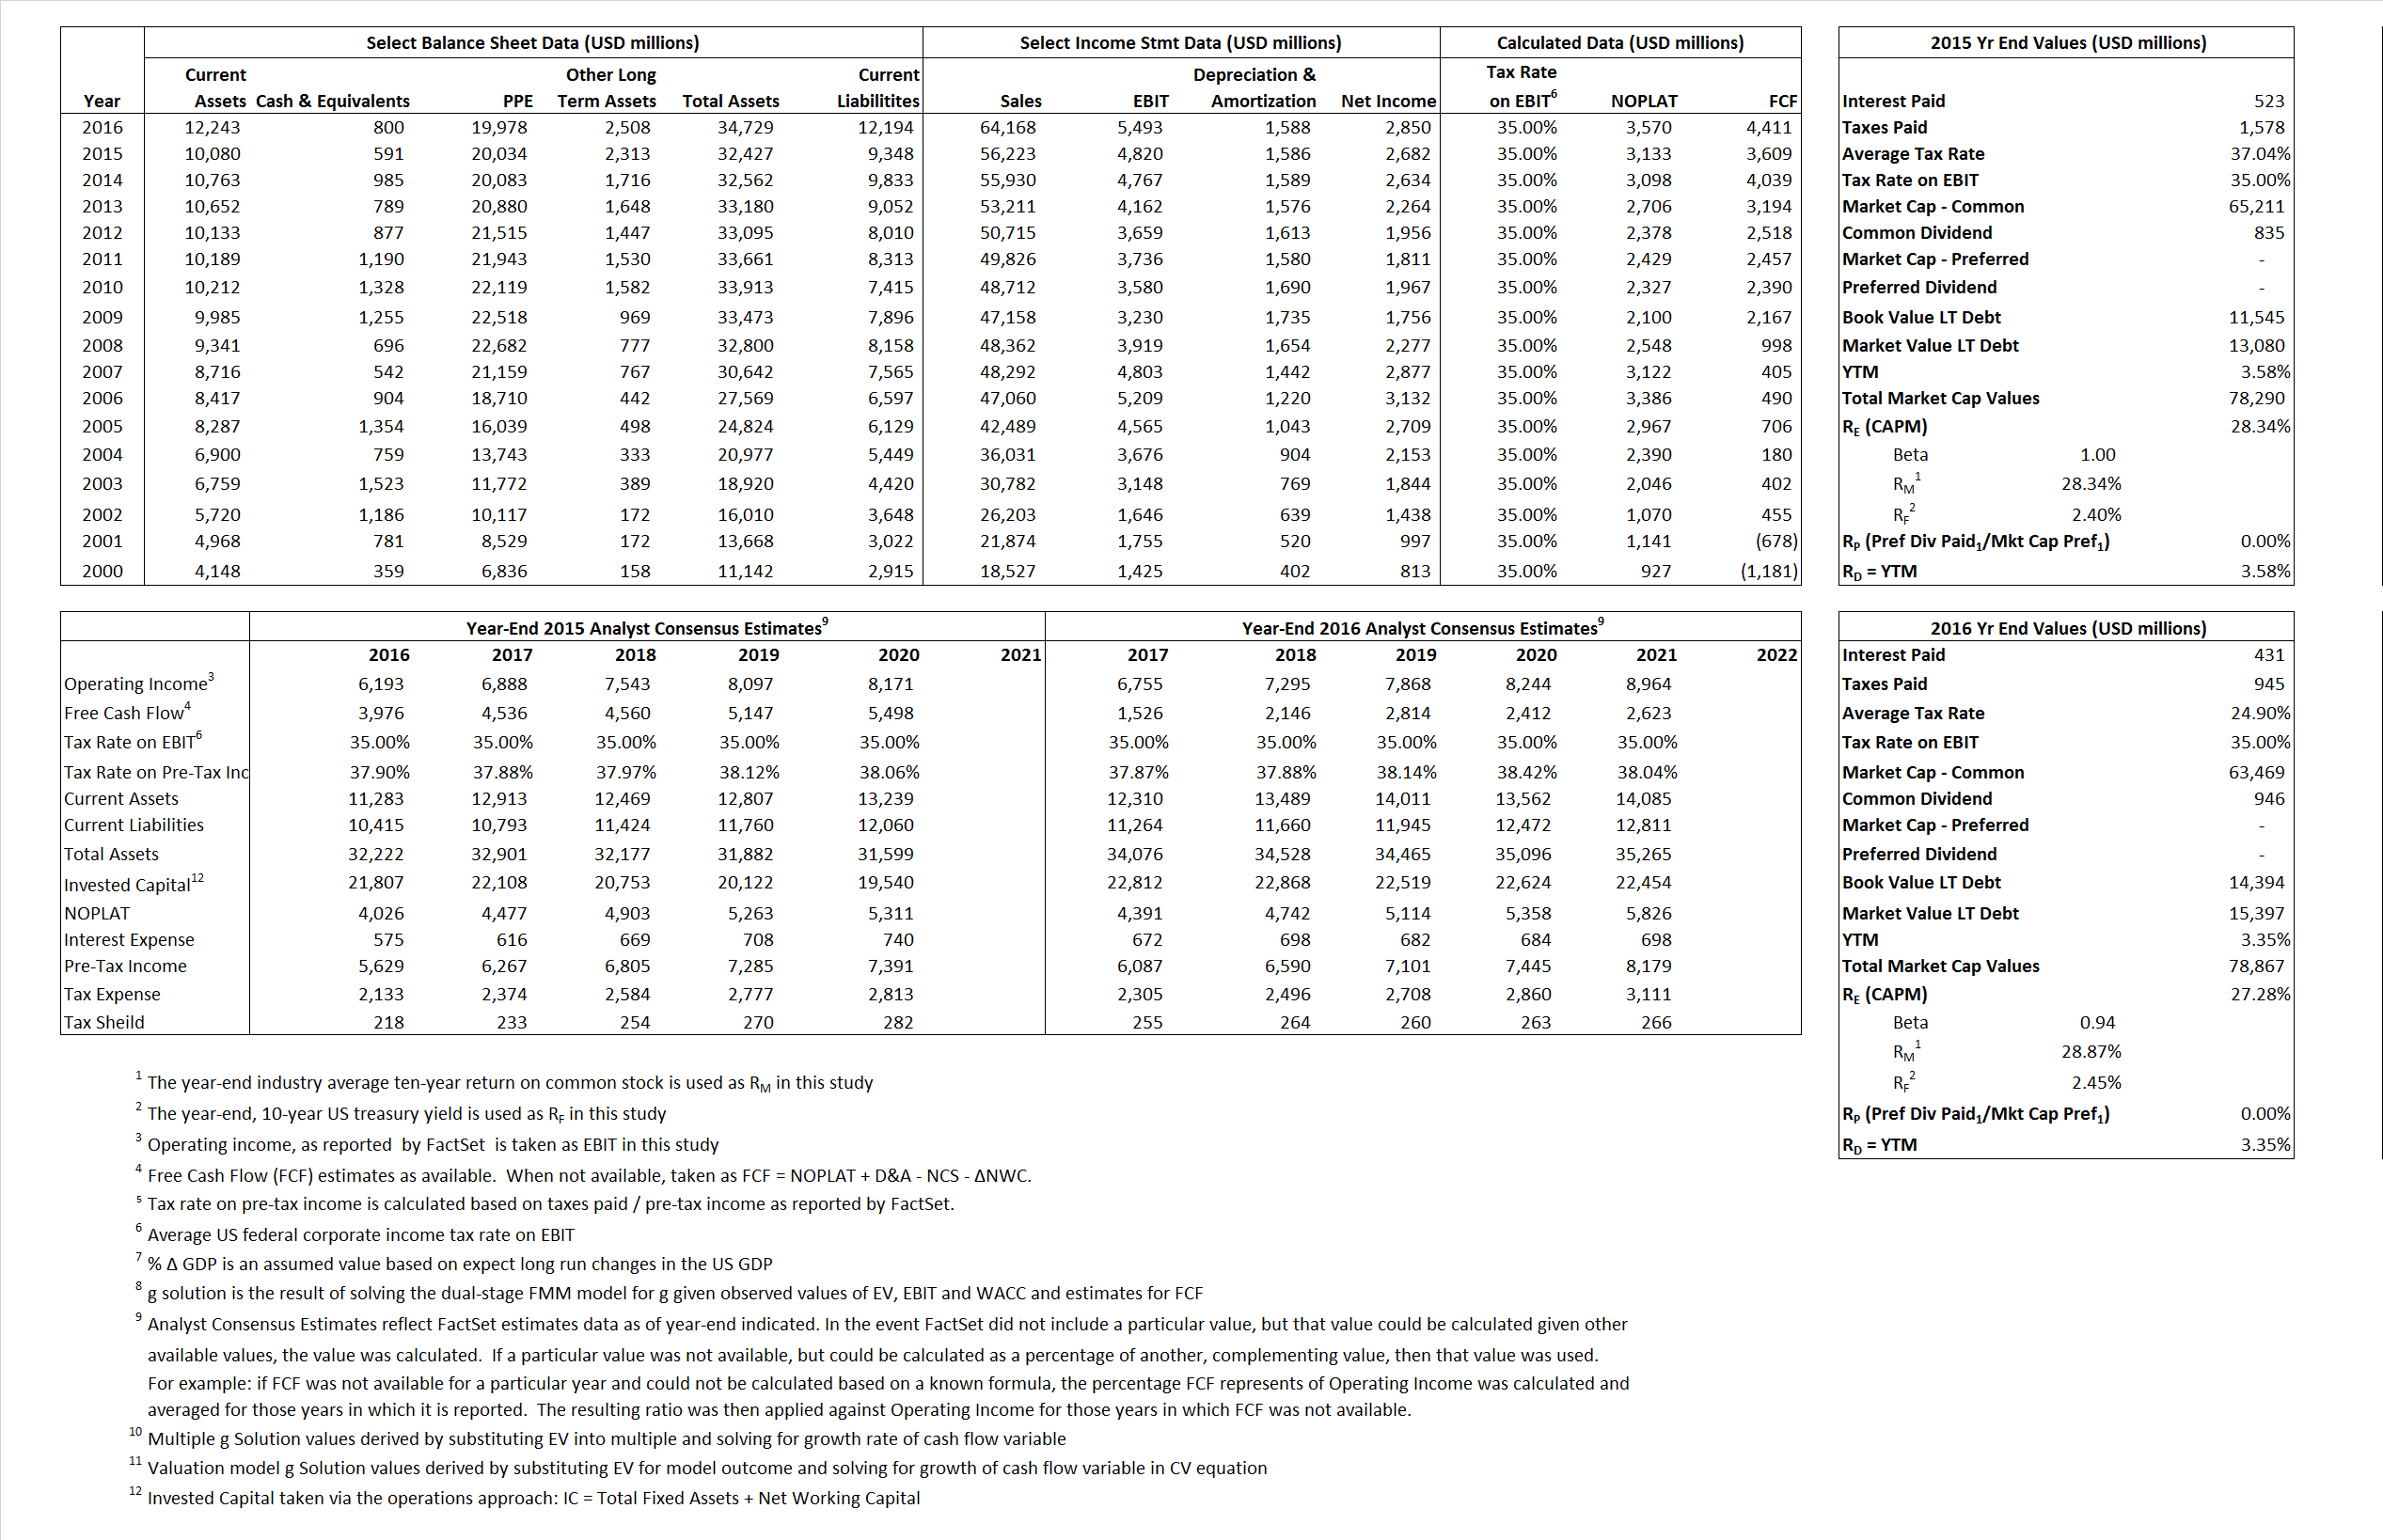
Derived Input Data
Derived Input |
Label |
2015 Value |
2016
|
Equational Form |
| Net Operating Profit Less Adjusted Taxes | NOPLAT | 3,133 | 3,570 |  |
| Free Cash Flow | FCF | 3,609 | 4,411 |  |
| Tax Shield | TS | 194 | 107 |  |
| Invested Capital | IC | 23,079 | 22,535 |  |
| Return on Invested Capital | ROIC | 13.58% | 15.84% |  |
| Net Investment | NetInv | 1,936 | 1,044 |  |
| Investment Rate | IR | 61.80% | 29.23% |  |
| Weighted Average Cost of Capital |
WACCMarket | 23.98% | 22.45% |  |
| WACCBook | 7.31% | 7.62% | ||
| Enterprise value |
EVMarket | 77,699 | 78,067 |  |
| EVBook | 75,956 | 77,063 | ||
| Long-Run Growth |
g = IR x ROIC |
8.39% | 4.63% | Long-run growth rates of the income variable are used in the Continuing Value portion of the valuation models. |
g = %  GDP GDP |
2.50% | 2.50% | ||
| Margin from Operations | M | 8.57% | 8.56% |  |
| Depreciation/Amortization Rate | D | 24.76% | 22.43% |  |
Valuation Multiple Outcomes
The outcomes presented in this study are the result of original input data, derived data, and synthesized inputs.
Equational Form |
Observed Value |
Single-stagemultiple g solution |
Two-stage valuationmodel g solution |
|||
| 12/31/2015 | 12/31/2016 | 12/31/2015 | 12/31/2016 | 12/31/2015 | 12/31/2016 | |
|
|
1.38 | 1.22 | 28.38% | 25.13% | 25.41% | 23.22% |
|
|
12.13 | 11.02 | 28.38% | 25.13% | 25.41% | 23.22% |
|
|
24.80 | 21.86 | 28.38% | 25.13% | 25.41% | 23.22% |
|
|
21.53 | 17.70 | 28.38% | 25.13% | 25.41% | 23.22% |
|
|
16.12 | 14.21 | 28.38% | 25.13% | 25.41% | 23.22% |
|
|
3.37 | 3.36 | 28.38% | 25.13% | 25.41% | 23.22% |


