Merck & Co.
Analyst Listing
The following analysts provide coverage for the subject firm as of May 2016:
| Broker | Analyst | Analyst Email |
| BMO Capital Markets | Alex Arfaei | alex.arfaei@bmo.com |
| Berenberg | Alistair Campbell | alistair.campbell@berenberg.com |
| Morningstar | Damien Conover | damien.conover@morningstar.com |
| Argus Research | David Toung | dtoung@argusresearch.com |
| Societe Generale | Florent Cespedes | florent.cespedes@sgcib.com |
| Deutsche Bank Research | Gregg Gilbert | tony.butler@guggenheimpartners.com |
| Erste Group | Hans Engel | hans.engel@erstegroup.com |
| Jefferies | Jeffrey Holford | jholford@jefferies.com |
| SunTrust Robinson Humphrey | John T. Boris | john.t.boris@suntrust.com |
| Evercore ISI | Mark Schoenebaum | mark.schoenebaum@evercoreisi.com |
| Piper Jaffray | Richard J. Purkiss | richard.j.purkiss@pjc.com |
| Leerink Partners | Seamus Fernandez | seamus.fernandez@leerink.com |
| Cowen & Company | Steve Scala | steve.scala@cowen.com |
| Bernstein Research | Tim Anderson | tim.anderson@bernstein.com |
| Guggenheim Securities | Tony Butler | tony.butler@guggenheimpartners.com |
| Credit Suisse | Vamil Divan | vamil.divan@credit-suisse.com |
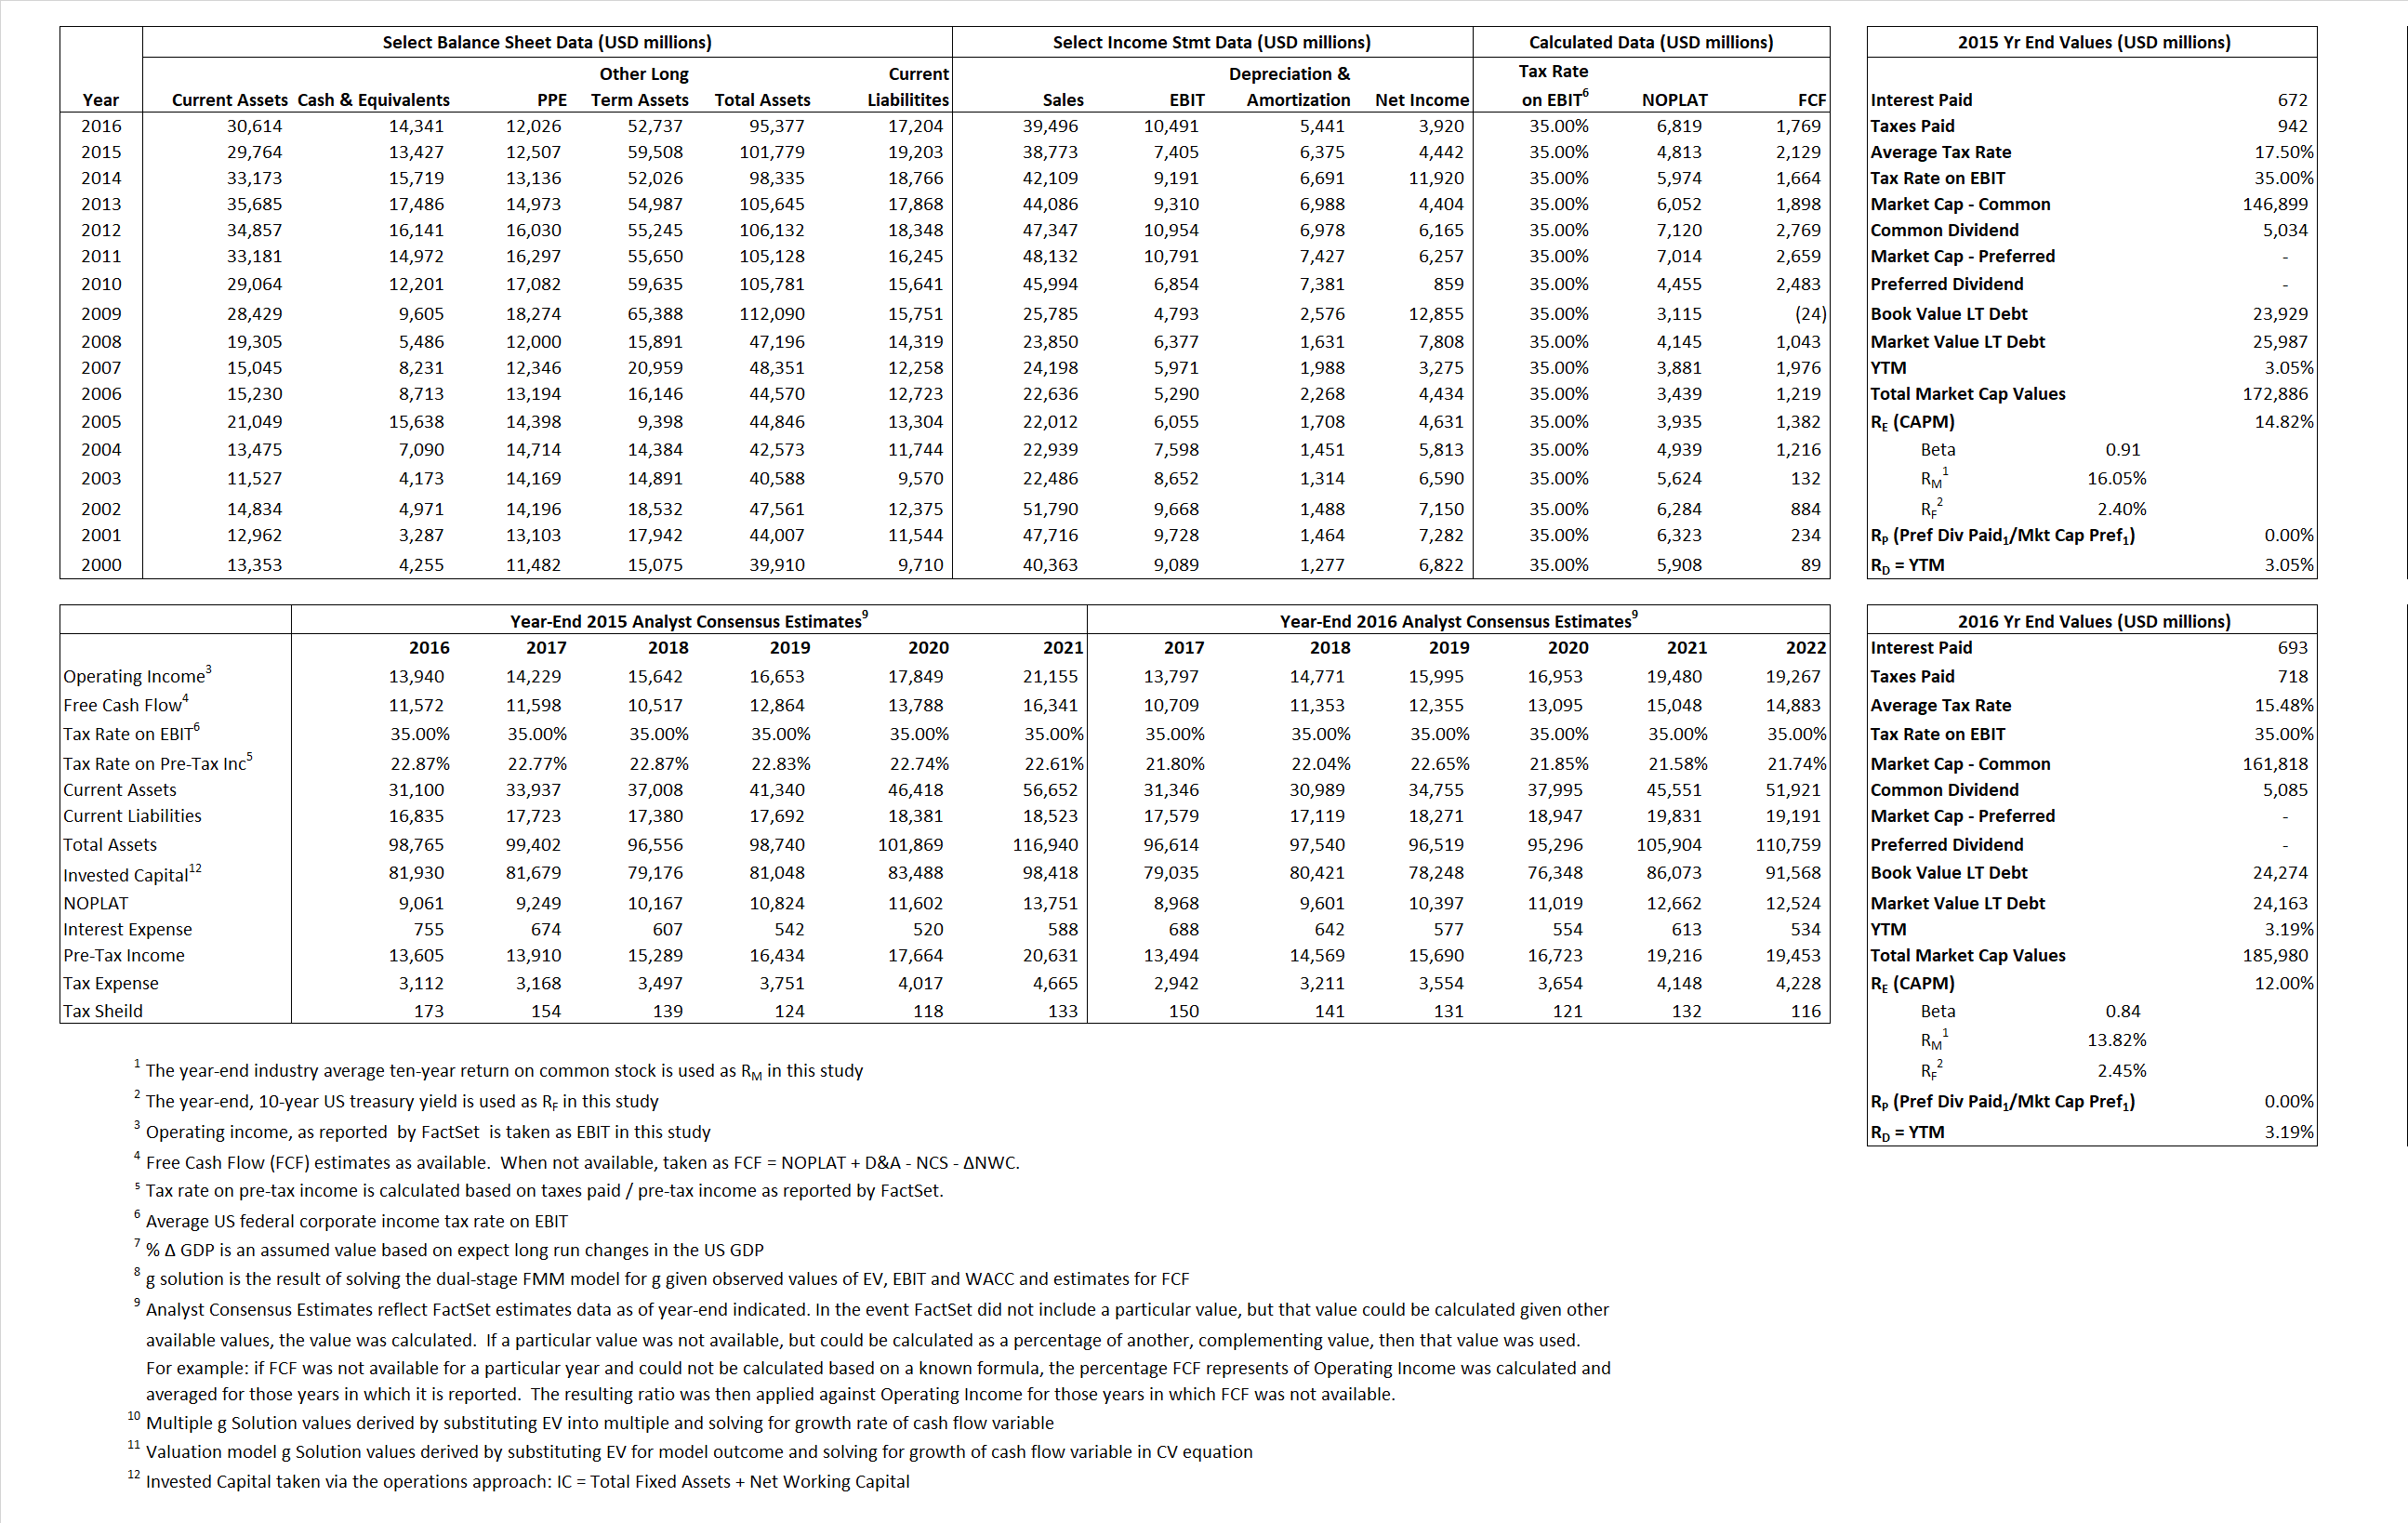
Primary Input Data
Derived Input Data
Derived Input |
Label |
2015 Value |
2016
|
Equational Form |
| Net Operating Profit Less Adjusted Taxes | NOPLAT | 4,813 | 6,819 |  |
| Free Cash Flow | FCF | 2,129 | 1,769 |  |
| Tax Shield | TS | 118 | 107 |  |
| Invested Capital | IC | 82,576 | 78,173 |  |
| Return on Invested Capital | ROIC | 5.83% | 8.72% |  |
| Net Investment | NetInv | 9,382 | 1,038 |  |
| Investment Rate | IR | 194.92% | 15.22% |  |
| Weighted Average Cost of Capital |
WACCMarket | 12.97% | 10.79% |  |
| WACCBook | 7.73% | 7.21% | ||
| Enterprise value |
EVMarket | 159,459 | 171,639 |  |
| EVBook | 156,487 | 171,751 | ||
| Long-Run Growth |
g = IR x ROIC |
11.36% | 1.33% | Long-run growth rates of the income variable are used in the Continuing Value portion of the valuation models. |
g = %  GDP GDP |
2.50% | 2.50% | ||
| Margin from Operations | M | 19.10% | 26.56% |  |
| Depreciation/Amortization Rate | D | 46.26% | 34.15% |  |
Valuation Multiple Outcomes
The outcomes presented in this study are the result of original input data, derived data, and synthesized inputs.
Equational Form |
Observed Value |
Single-stagemultiple g solution |
Two-stage valuationmodel g solution |
|||
| 12/31/2015 | 12/31/2016 | 12/31/2015 | 12/31/2016 | 12/31/2015 | 12/31/2016 | |
|
|
4.11 | 4.35 | 20.64% | 12.52% | 17.39% | 11.57% |
|
|
11.57 | 10.77 | 20.64% | 12.52% | 17.39% | 11.57% |
|
|
33.13 | 25.17 | 20.64% | 12.52% | 17.39% | 11.57% |
|
|
74.91 | 97.03 | 20.64% | 12.52% | 17.39% | 11.57% |
|
|
21.53 | 16.36 | 20.64% | 12.52% | 17.39% | 11.57% |
|
|
1.93 | 2.20 | 20.64% | 12.52% | 17.39% | 11.57% |


