CVS Health Corporation
Analyst Listing
The following analysts provide coverage for the subject firm as of May 2016:
| Broker | Analyst | Analyst Email |
| Stephens Inc | Ben Wyatt | ben.wyatt@stephens.com |
| Susquehanna Financial Group | Biju Perincheril | biju.perincheril@sig.com |
| Johnson Rice & Company | Charles Meade | cmeade@jrco.com |
| Cowen & Company | Charles Robertson | charles.robertson@cowen.com |
| Piper Jaffray | David Kistler | david.w.kistler@simmonspjc.com |
| Wells Fargo Securities | David Tameron | david.tameron@wellsfargo.com |
| GMP Securities | Derrick Whitfield | dwhitfield@gmpsecurities.com |
| Credit Suisse | Edward Westlake | edward.westlake@credit-suisse.com |
| IBERIA Capital Partners | Eric Fox | eric.fox@iberiabank.com |
| Alembic Global Advisors | James Sullivan | james.sullivan@alembicglobal.com |
| KLR Group | John Gerdes | jjg@klrgroup.com |
| Jefferies | Jonathan D. Wolff | jwolff@jefferies.com |
| Raymond James | Kevin Smith | kevin.smith@raymondjames.com |
| Nomura Research | Lloyd Byrne | lloyd.byrne@nomura.com |
| Jefferies | Mark Wiltamuth | mwiltamuth@jefferies.com |
| Seaport Global Securities | Michael Kelly | mkelly@seaportglobal.com |
| Mitsubishi UFJ Securities (USA) | Michael McAllister | mmcallister@us.sc.mufg.jp |
| Oppenheimer | Mohan Naidu | mohan.naidu@opco.com |
| Wolfe Research | Paul Sankey | psankey@wolferesearch.com |
| Scotia Howard Weil | Peter Kissel | peter.kissel@scotiabank.com |
| BMO Capital Markets | Phillip Jungwirth | phillip.jungwirth@bmo.com |
| Capital One Securities | Phillips Johnston | phillips.johnston@capitalone.com |
| Deutsche Bank Research | Ryan Todd | ryan.todd@db.com |
| RBC Capital Markets | Scott Hanold | scott.hanold@rbccm.com |
| Evercore ISI | Stephen Richardson | stephen.richardson@evercoreisi.com |
| Guggenheim Securities | Subash Chandra | subash.chandra@guggenheimpartners.com |
| Wunderlich Securities | Vedran Vuk | vedranvuk@wundernet.com |
| Mizuho Securities USA | Ann Hynes | ann.hynes@us.mizuho-sc.com |
| Cowen & Company | Charles Rhyee | charles.rhyee@cowen.com |
| RBC Capital Markets | David Francis | david.francis@rbccm.com |
| Leerink Partners | David Larsen | david.larsen@leerink.com |
| SunTrust Robinson Humphrey | David S. MacDonald | david.macdonald@suntrust.com |
| Deutsche Bank Research | George Hill | george.hill@db.com |
| Guggenheim Securities | John Heinbockel | john.heinbockel@guggenheimpartners.com |
| Raymond James | John W. Ransom | john.ransom@raymondjames.com |
| Jefferies | Mark Wiltamuth | mwiltamuth@jefferies.com |
| Oppenheimer | Mohan Naidu | mohan.naidu@opco.com |
| Wells Fargo Securities | Peter Costa | peter.costa@wellsfargo.com |
| Credit Suisse | Robert M. Willoughby | robert.willoughby@credit-suisse.com |
| Atlantic Equities | Sam Hudson | s.hudson@atlantic-equities.com |
| Wolfe Research | Scott Mushkin | smushkin@wolferesearch.com |
| FBR Capital Markets & Co | Steven Halper | shalper@fbr.com |
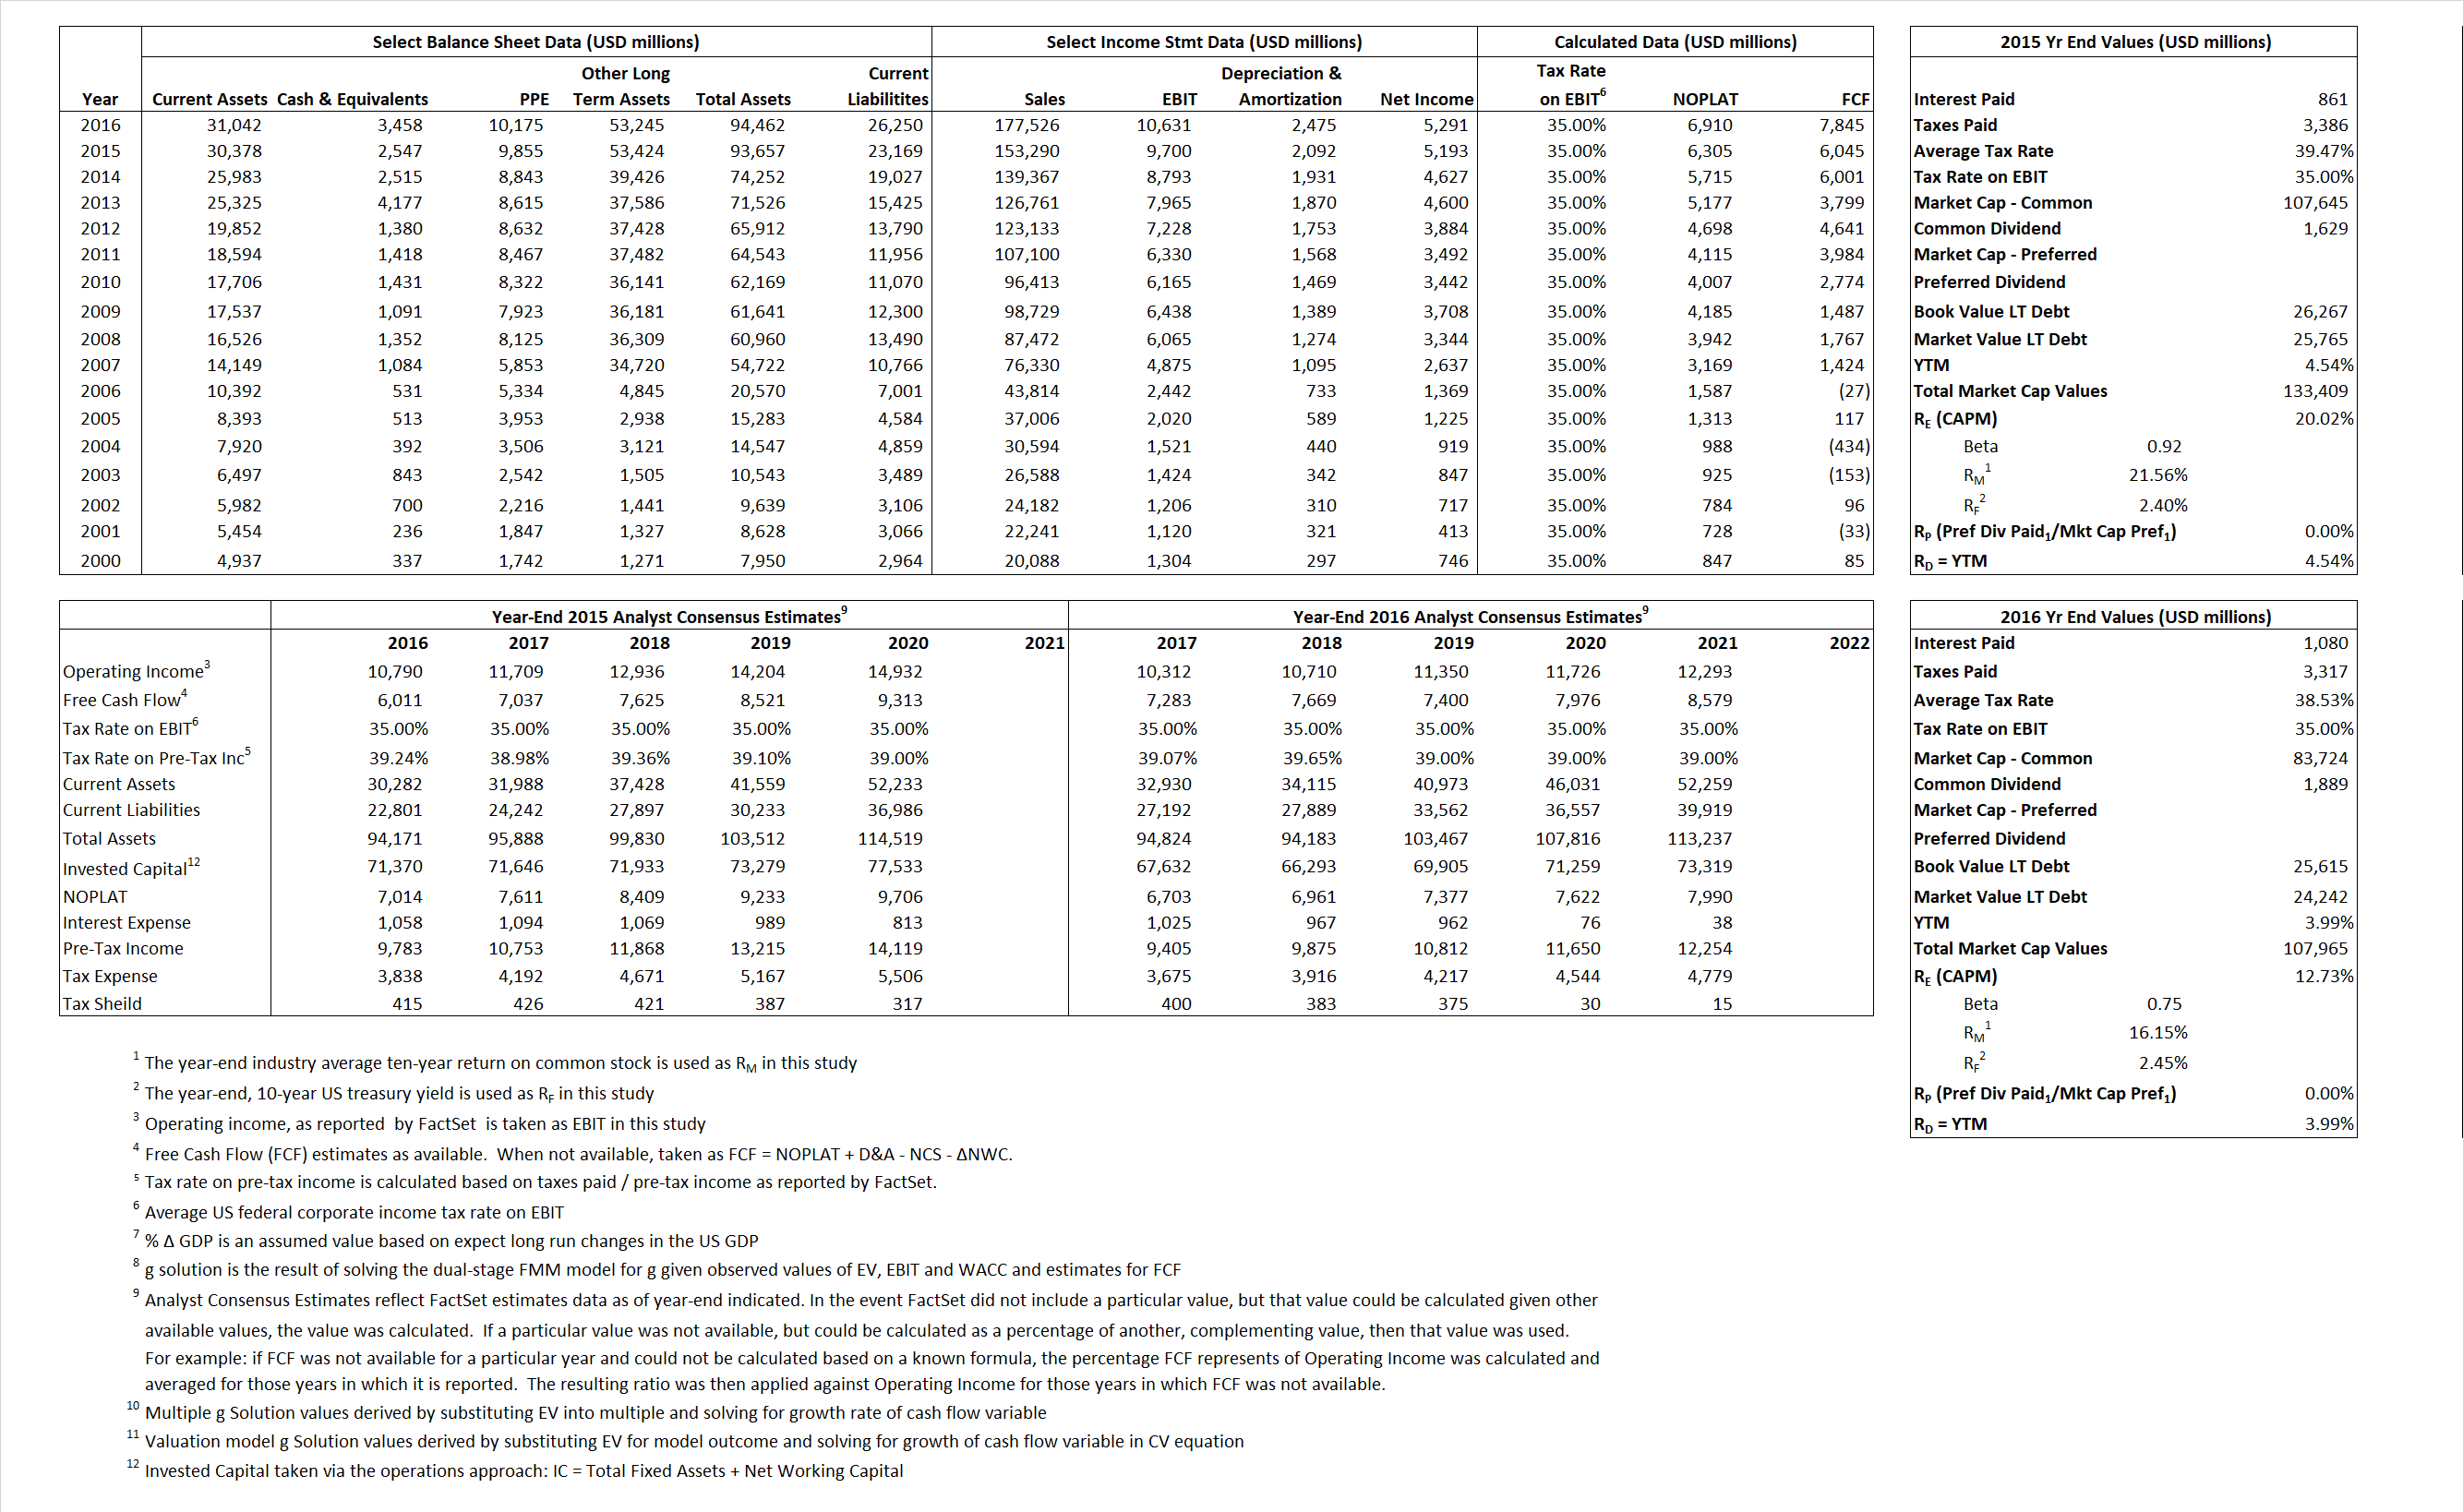
Primary Input Data
Derived Input Data
Derived Input |
Label |
2015 Value |
2016
|
Equational Form |
| Net Operating Profit Less Adjusted Taxes | NOPLAT | 6,305 | 6,910 |  |
| Free Cash Flow | FCF | 6,045 | 7,845 |  |
| Tax Shield | TS | 340 | 416 |  |
| Invested Capital | IC | 70,488 | 68,212 |  |
| Return on Invested Capital | ROIC | 8.94% | 10.13% |  |
| Net Investment | NetInv | 17,355 | 199 |  |
| Investment Rate | IR | 275.26% | 2.88% |  |
| Weighted Average Cost of Capital |
WACCMarket | 16.69% | 10.42% |  |
| WACCBook | 7.39% | 9.44% | ||
| Enterprise value |
EVMarket | 130,862 | 104,507 |  |
| EVBook | 131,365 | 105,881 | ||
| Long-Run Growth |
g = IR x ROIC |
24.62% | 0.29% | Long-run growth rates of the income variable are used in the Continuing Value portion of the valuation models. |
g = %  GDP GDP |
2.50% | 2.50% | ||
| Margin from Operations | M | 6.33% | 5.99% |  |
| Depreciation/Amortization Rate | D | 17.74% | 18.88% |  |
Valuation Multiple Outcomes
The outcomes presented in this study are the result of original input data, derived data, and synthesized inputs.
Equational Form |
Observed Value |
Single-stagemultiple g solution |
Two-stage valuationmodel g solution |
|||
| 12/31/2015 | 12/31/2016 | 12/31/2015 | 12/31/2016 | 12/31/2015 | 12/31/2016 | |
|
|
0.85 | 0.59 | 25.73% | 10.96% | 20.08% | 10.61% |
|
|
11.10 | 7.97 | 25.73% | 10.96% | 20.08% | 10.61% |
|
|
20.76 | 15.12 | 25.73% | 10.96% | 20.08% | 10.61% |
|
|
21.65 | 13.32 | 25.73% | 10.96% | 20.08% | 10.61% |
|
|
13.49 | 9.83 | 25.73% | 10.96% | 20.08% | 10.61% |
|
|
1.86 | 1.53 | 25.73% | 10.96% | 20.08% | 10.61% |


