eBay Inc.
Analyst Listing
The following analysts provide coverage for the subject firm as of May 2016:
| Broker | Analyst | Analyst Email |
| Raymond James | Aaron Kessler | aaron.kessler@raymondjames.com |
| Jefferies | Brian Pitz | bpitz@jefferies.com |
| Bernstein Research | Carlos Kirjner | carlos.kirjner@bernstein.com |
| Monness Crespi Hardt | Cengiz M. Cakmak | jcakmak@mchny.com |
| The Benchmark Company, LLC | Daniel L. Kurnos | dkurnos@benchmarkcompany.com |
| BMO Capital Markets | Daniel Salmon | dan.salmon@bmo.com |
| Piper Jaffray | Gene Munster | gene.a.munster@pjc.com |
| Wedbush Securities | Gil Luria | gil.luria@wedbush.com |
| Atlantic Equities | James Cordwell | j.cordwell@atlantic-equities.com |
| Cowen & Company | John Blackledge | john.blackledge@cowen.com |
| Daiwa Securities Co. Ltd. | Kazuya Nishimura | kazuya.nishimura@us.daiwacm.com |
| Evercore ISI | Ken Sena | ken.sena@evercoreisi.com |
| Needham | Kerry Rice | krice@needhamco.com |
| RBC Capital Markets | Mark S. Mahaney | mark.mahaney@rbccm.com |
| Canaccord Genuity | Michael Graham | mgraham@canaccordgenuity.com |
| Mizuho Securities USA | Neil A. Doshi | neil.doshi@us.mizuho-sc.com |
| SunTrust Robinson Humphrey | Robert S. Peck | robert.peck@suntrust.com |
| JMP Securities | Ronald V. Josey | rjosey@jmpsecurities.com |
| Stifel Nicolaus | Scott W. Devitt | swdevitt@stifel.com |
| FBN Securities | Shebly Seyrafi | sseyrafi@fbnsecurities.com |
| Susquehanna Financial Group | Shyam Patil | shyam.patil@sig.com |
| Credit Suisse | Stephen Ju | stephen.ju@credit-suisse.com |
| Axiom Capital | Victor Anthony | vanthony@axiomcapital.com |
| Cantor Fitzgerald | Youssef H. Squali | ysquali@cantor.com |
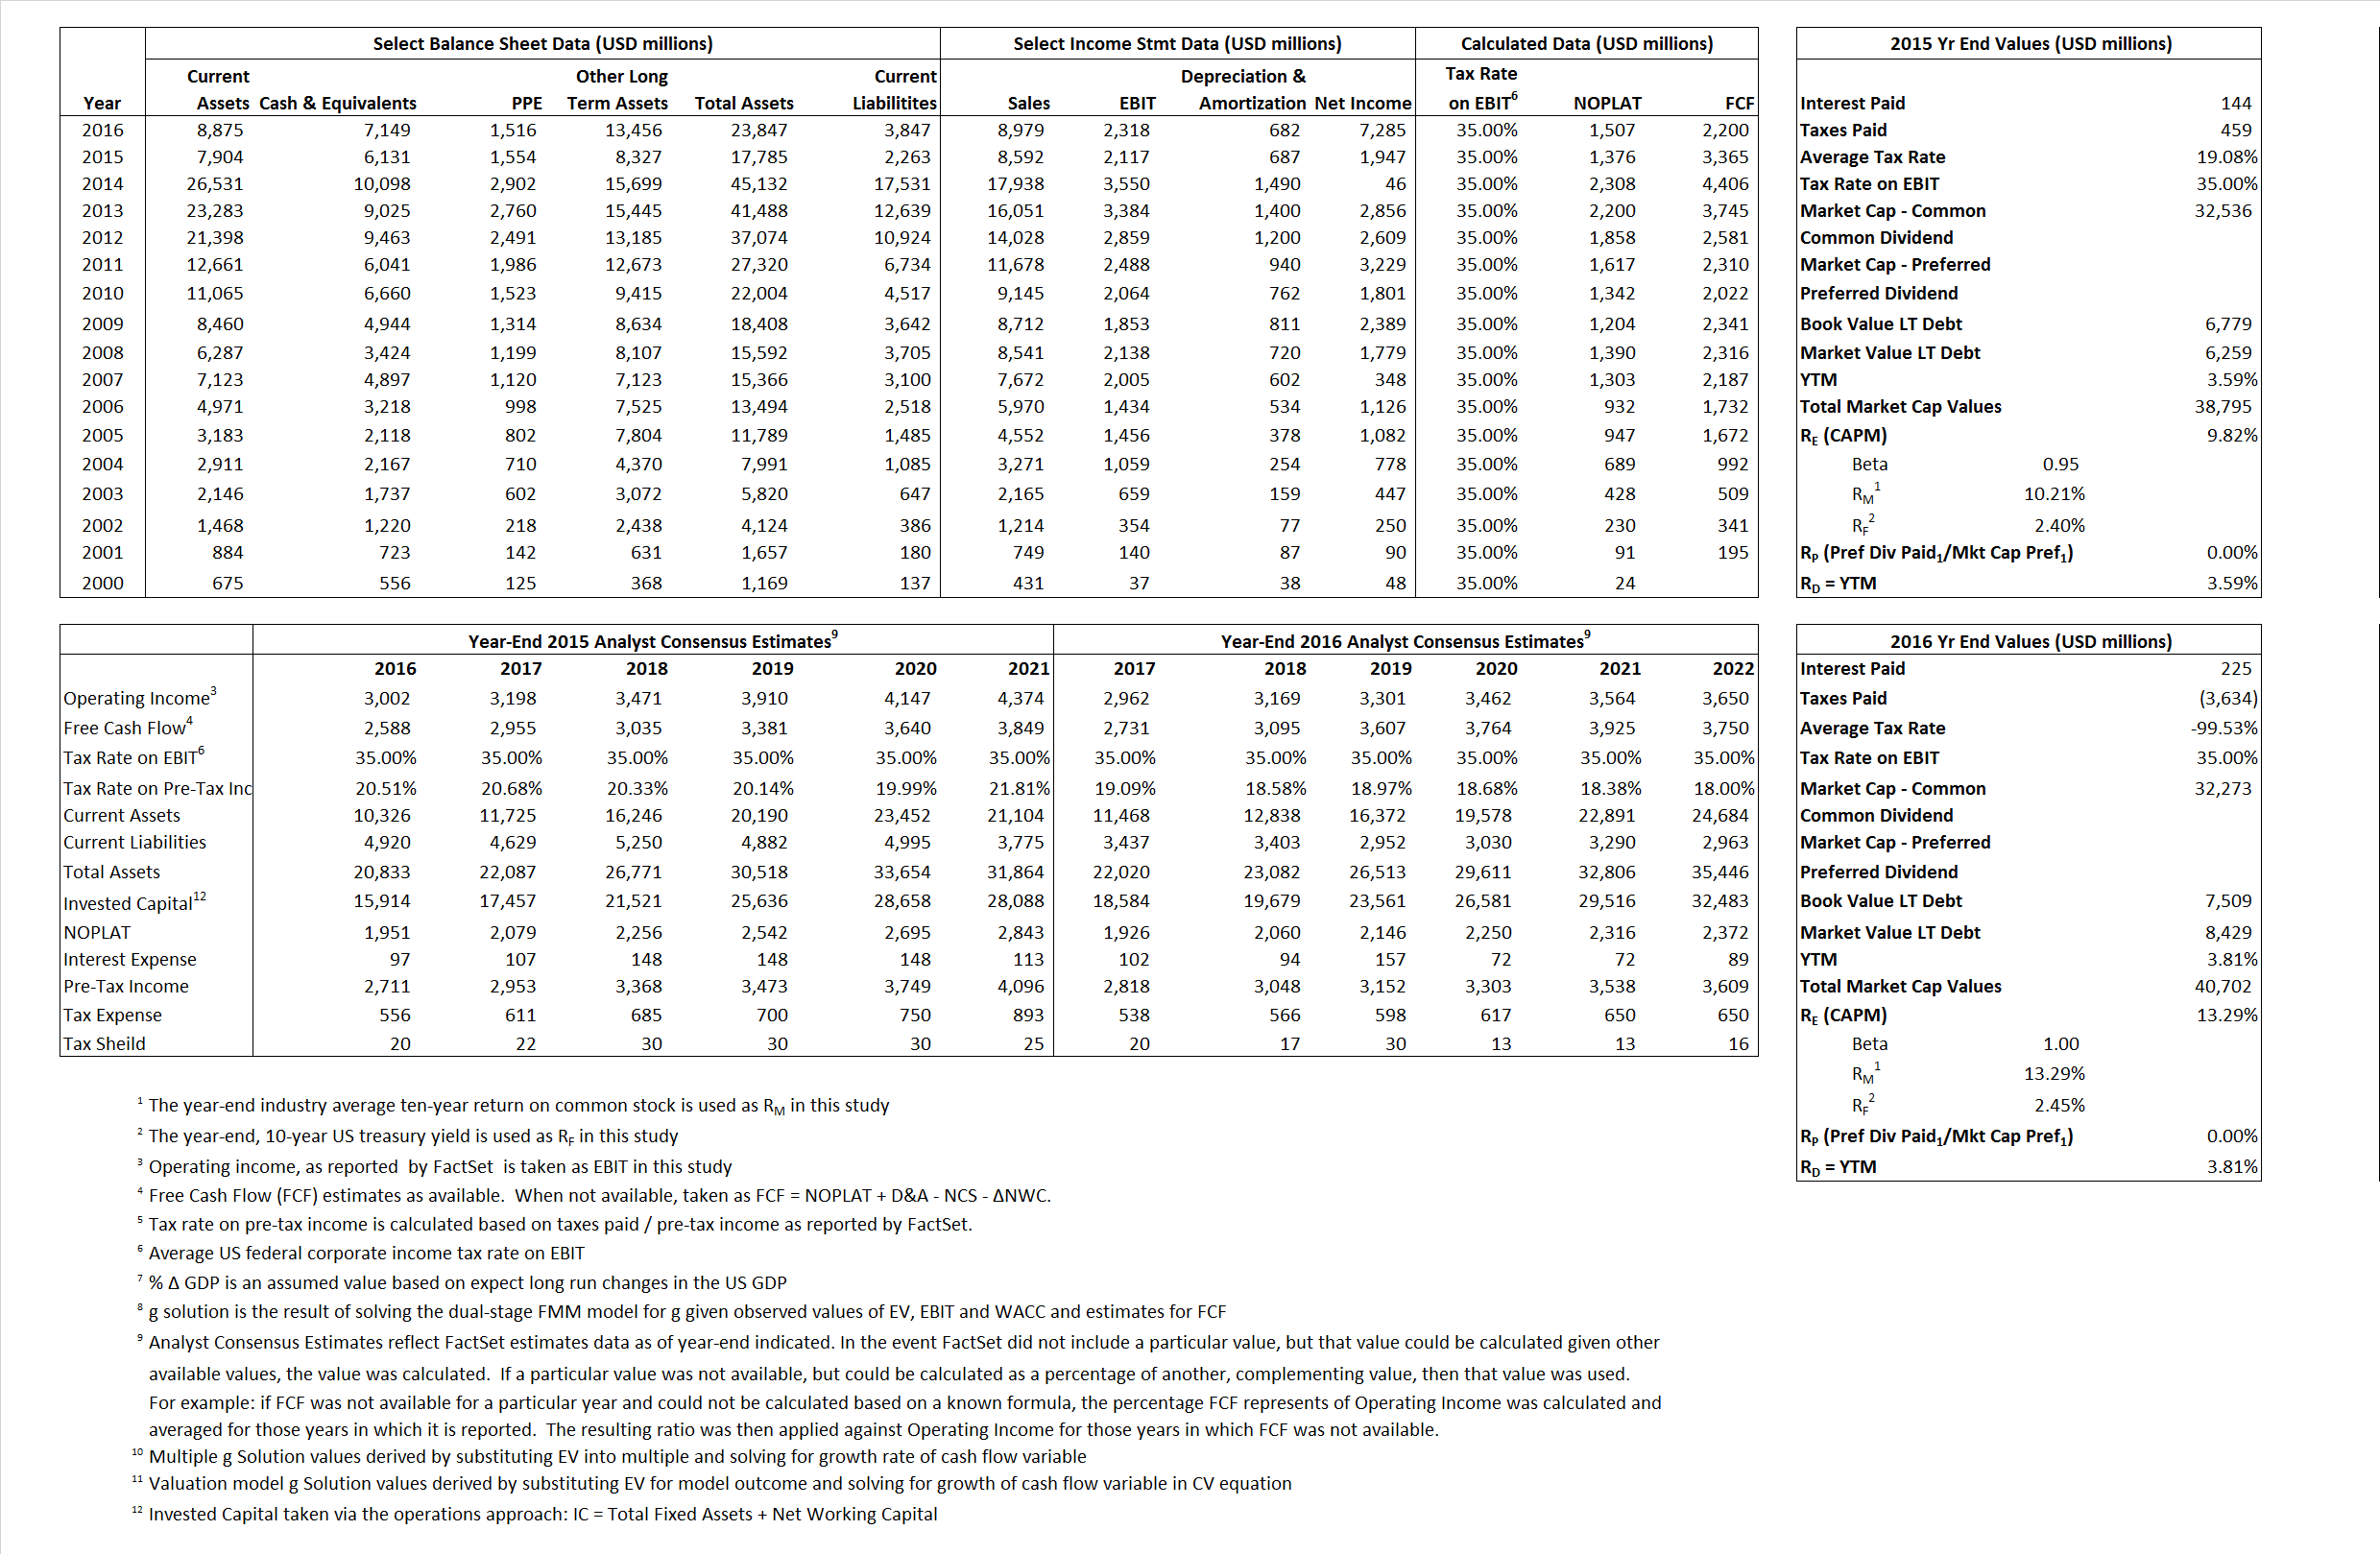
Primary Input Data
Derived Input Data
Derived Input |
Label |
2015 Value |
2016
|
Equational Form |
| Net Operating Profit Less Adjusted Taxes | NOPLAT | 1,376 | 1,507 |  |
| Free Cash Flow | FCF | 3,365 | 2,200 |  |
| Tax Shield | TS | 27 | (224) |  |
| Invested Capital | IC | 15,522 | 20,000 |  |
| Return on Invested Capital | ROIC | 8.87% | 7.53% |  |
| Net Investment | NetInv | (11,392) | 5,160 |  |
| Investment Rate | IR | -827.88% | 342.47% |  |
| Weighted Average Cost of Capital |
WACCMarket | 8.70% | 12.11% |  |
| WACCBook | 7.91% | 7.67% | ||
| Enterprise value |
EVMarket | 32,664 | 33,553 |  |
| EVBook | 33,184 | 32,633 | ||
| Long-Run Growth |
g = IR x ROIC |
-73.39% | 25.80% | Long-run growth rates of the income variable are used in the Continuing Value portion of the valuation models. |
g = %  GDP GDP |
2.50% | 2.50% | ||
| Margin from Operations | M | 24.64% | 25.82% |  |
| Depreciation/Amortization Rate | D | 24.50% | 22.73% |  |
Valuation Multiple Outcomes
The outcomes presented in this study are the result of original input data, derived data, and synthesized inputs.
Equational Form |
Observed Value |
Single-stagemultiple g solution |
Two-stage valuationmodel g solution |
|||
| 12/31/2015 | 12/31/2016 | 12/31/2015 | 12/31/2016 | 12/31/2015 | 12/31/2016 | |
|
|
3.80 | 3.74 | 8.56% | 18.87% | 8.55% | 14.43% |
|
|
11.65 | 11.18 | 8.56% | 18.87% | 8.55% | 14.43% |
|
|
23.74 | 22.27 | 8.56% | 18.87% | 8.55% | 14.43% |
|
|
9.71 | 15.25 | 8.56% | 18.87% | 8.55% | 14.43% |
|
|
15.43 | 14.47 | 8.56% | 18.87% | 8.55% | 14.43% |
|
|
2.10 | 1.68 | 8.56% | 18.87% | 8.55% | 14.43% |


