Biogen Idec
Analyst Listing
The following analysts provide coverage for the subject firm as of May 2016:
| Broker | Analyst | Analyst Email |
| Credit Suisse | Alethia Young | alethia.young@credit-suisse.com |
| HC Wainwright | Andrew S. Fein | afein@hcwresearch.com |
| Jefferies | Brian Abrahams | babrahams@jefferies.com |
| Raymond James | Christopher J. Raymond | chris.raymond@raymondjames.com |
| Cowen & Company | Eric Schmidt | eric.schmidt@cowen.com |
| Leerink Partners | Geoffrey C. Porges | geoffrey.porges@leerink.com |
| Wells Fargo Securities | Jim Birchenough | jim.birchenough@wellsfargo.com |
| William Blair | John Sonnier | jsonnier@williamblair.com |
| Piper Jaffray | Joshua Schimmer | joshua.e.schimmer@pjc.com |
| BMO Capital Markets | M. Ian Somaiya | ian.somaiya@bmo.com |
| Evercore ISI | Mark Schoenebaum | mark.schoenebaum@evercoreisi.com |
| RBC Capital Markets | Michael J. Yee | michael.yee@rbccm.com |
| Atlantic Equities | Steve Chesney | s.chesney@atlantic-equities.com |
| Stifel Nicolaus | Thomas Shrader | shradert@stifel.com |
| Guggenheim Securities | William Tanner | william.tanner@guggenheimpartners.com |
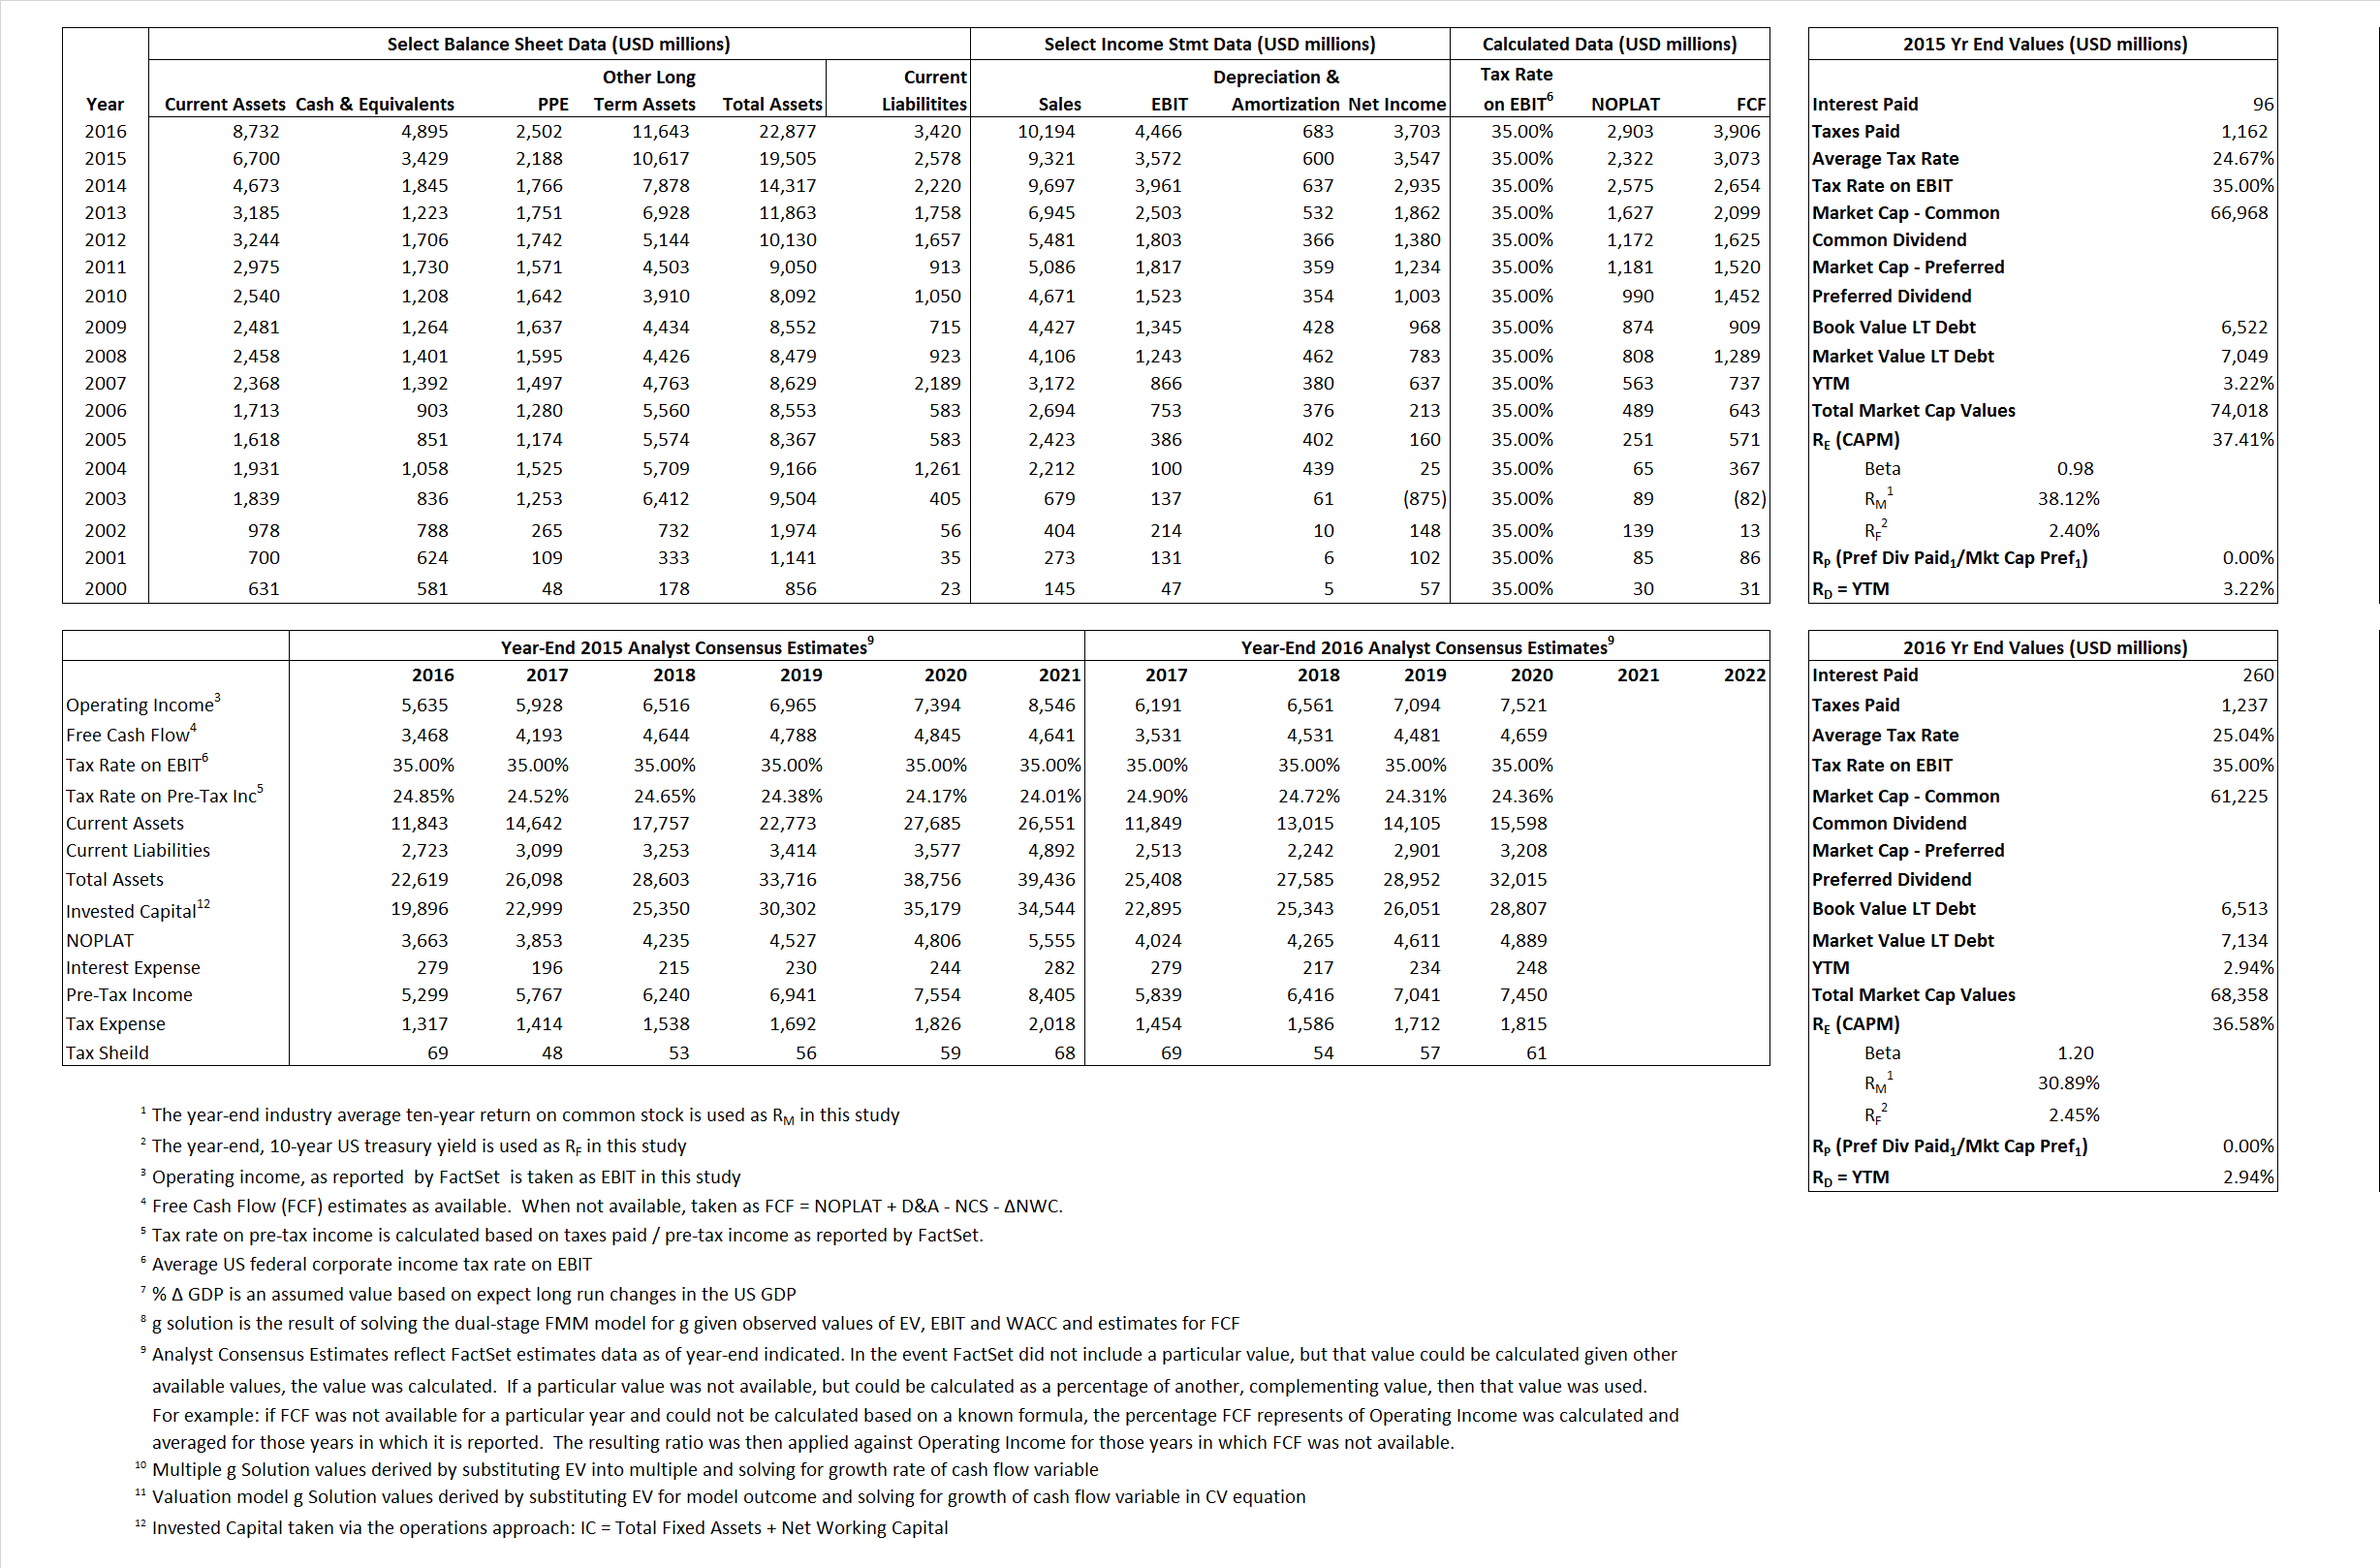
Primary Input Data
Derived Input Data
Derived Input |
Label |
2015 Value |
2016
|
Equational Form |
| Net Operating Profit Less Adjusted Taxes | NOPLAT | 2,322 | 2,903 |  |
| Free Cash Flow | FCF | 3,073 | 3,906 |  |
| Tax Shield | TS | 24 | 65 |  |
| Invested Capital | IC | 16,927 | 19,457 |  |
| Return on Invested Capital | ROIC | 13.72% | 14.92% |  |
| Net Investment | NetInv | 5,431 | 3,213 |  |
| Investment Rate | IR | 233.90% | 110.68% |  |
| Weighted Average Cost of Capital |
WACCMarket | 34.07% | 32.99% |  |
| WACCBook | 8.63% | 9.54% | ||
| Enterprise value |
EVMarket | 70,589 | 63,463 |  |
| EVBook | 70,061 | 62,843 | ||
| Long-Run Growth |
g = IR x ROIC |
32.08% | 16.51% | Long-run growth rates of the income variable are used in the Continuing Value portion of the valuation models. |
g = %  GDP GDP |
2.50% | 2.50% | ||
| Margin from Operations | M | 38.32% | 43.81% |  |
| Depreciation/Amortization Rate | D | 14.39% | 13.26% |  |
Valuation Multiple Outcomes
The outcomes presented in this study are the result of original input data, derived data, and synthesized inputs.
Equational Form |
Observed Value |
Single-stagemultiple g solution |
Two-stage valuationmodel g solution |
|||
| 12/31/2015 | 12/31/2016 | 12/31/2015 | 12/31/2016 | 12/31/2015 | 12/31/2016 | |
|
|
7.57 | 6.23 | 40.50% | 40.98% | 35.46% | 34.95% |
|
|
16.92 | 12.33 | 40.50% | 40.98% | 35.46% | 34.95% |
|
|
30.40 | 21.86 | 40.50% | 40.98% | 35.46% | 34.95% |
|
|
22.97 | 16.25 | 40.50% | 40.98% | 35.46% | 34.95% |
|
|
19.76 | 14.21 | 40.50% | 40.98% | 35.46% | 34.95% |
|
|
4.17 | 3.26 | 40.50% | 40.98% | 35.46% | 34.95% |


