BlackRock Inc
Analyst Listing
The following analysts provide coverage for the subject firm as of May 2016:
| Broker | Analyst | Analyst Email |
| Deutsche Bank Research | Brian Bedell | brian.bedell@db.com |
| Wells Fargo Securities | Christopher Harris | christopher.harris1@wellsfargo.com |
| Credit Suisse | Craig Siegenthaler | craig.siegenthaler@credit-suisse.com |
| Jefferies | Daniel T. Fannon | dfannon@jefferies.com |
| RBC Capital Markets | Eric N. Berg | eric.berg@rbccm.com |
| Evercore ISI | Glenn Schorr | glenn.schorr@evercoreisi.com |
| Piper Jaffray | Jason Weyeneth | jason.l.weyeneth@pjc.com |
| Bernstein Research | Luke Montgomery | lucas.montgomery@bernstein.com |
| Gabelli & Company | Macrae Sykes | msykes@gabelli.com |
| Keefe Bruyette & Woods | Robert Lee | rlee@kbw.com |
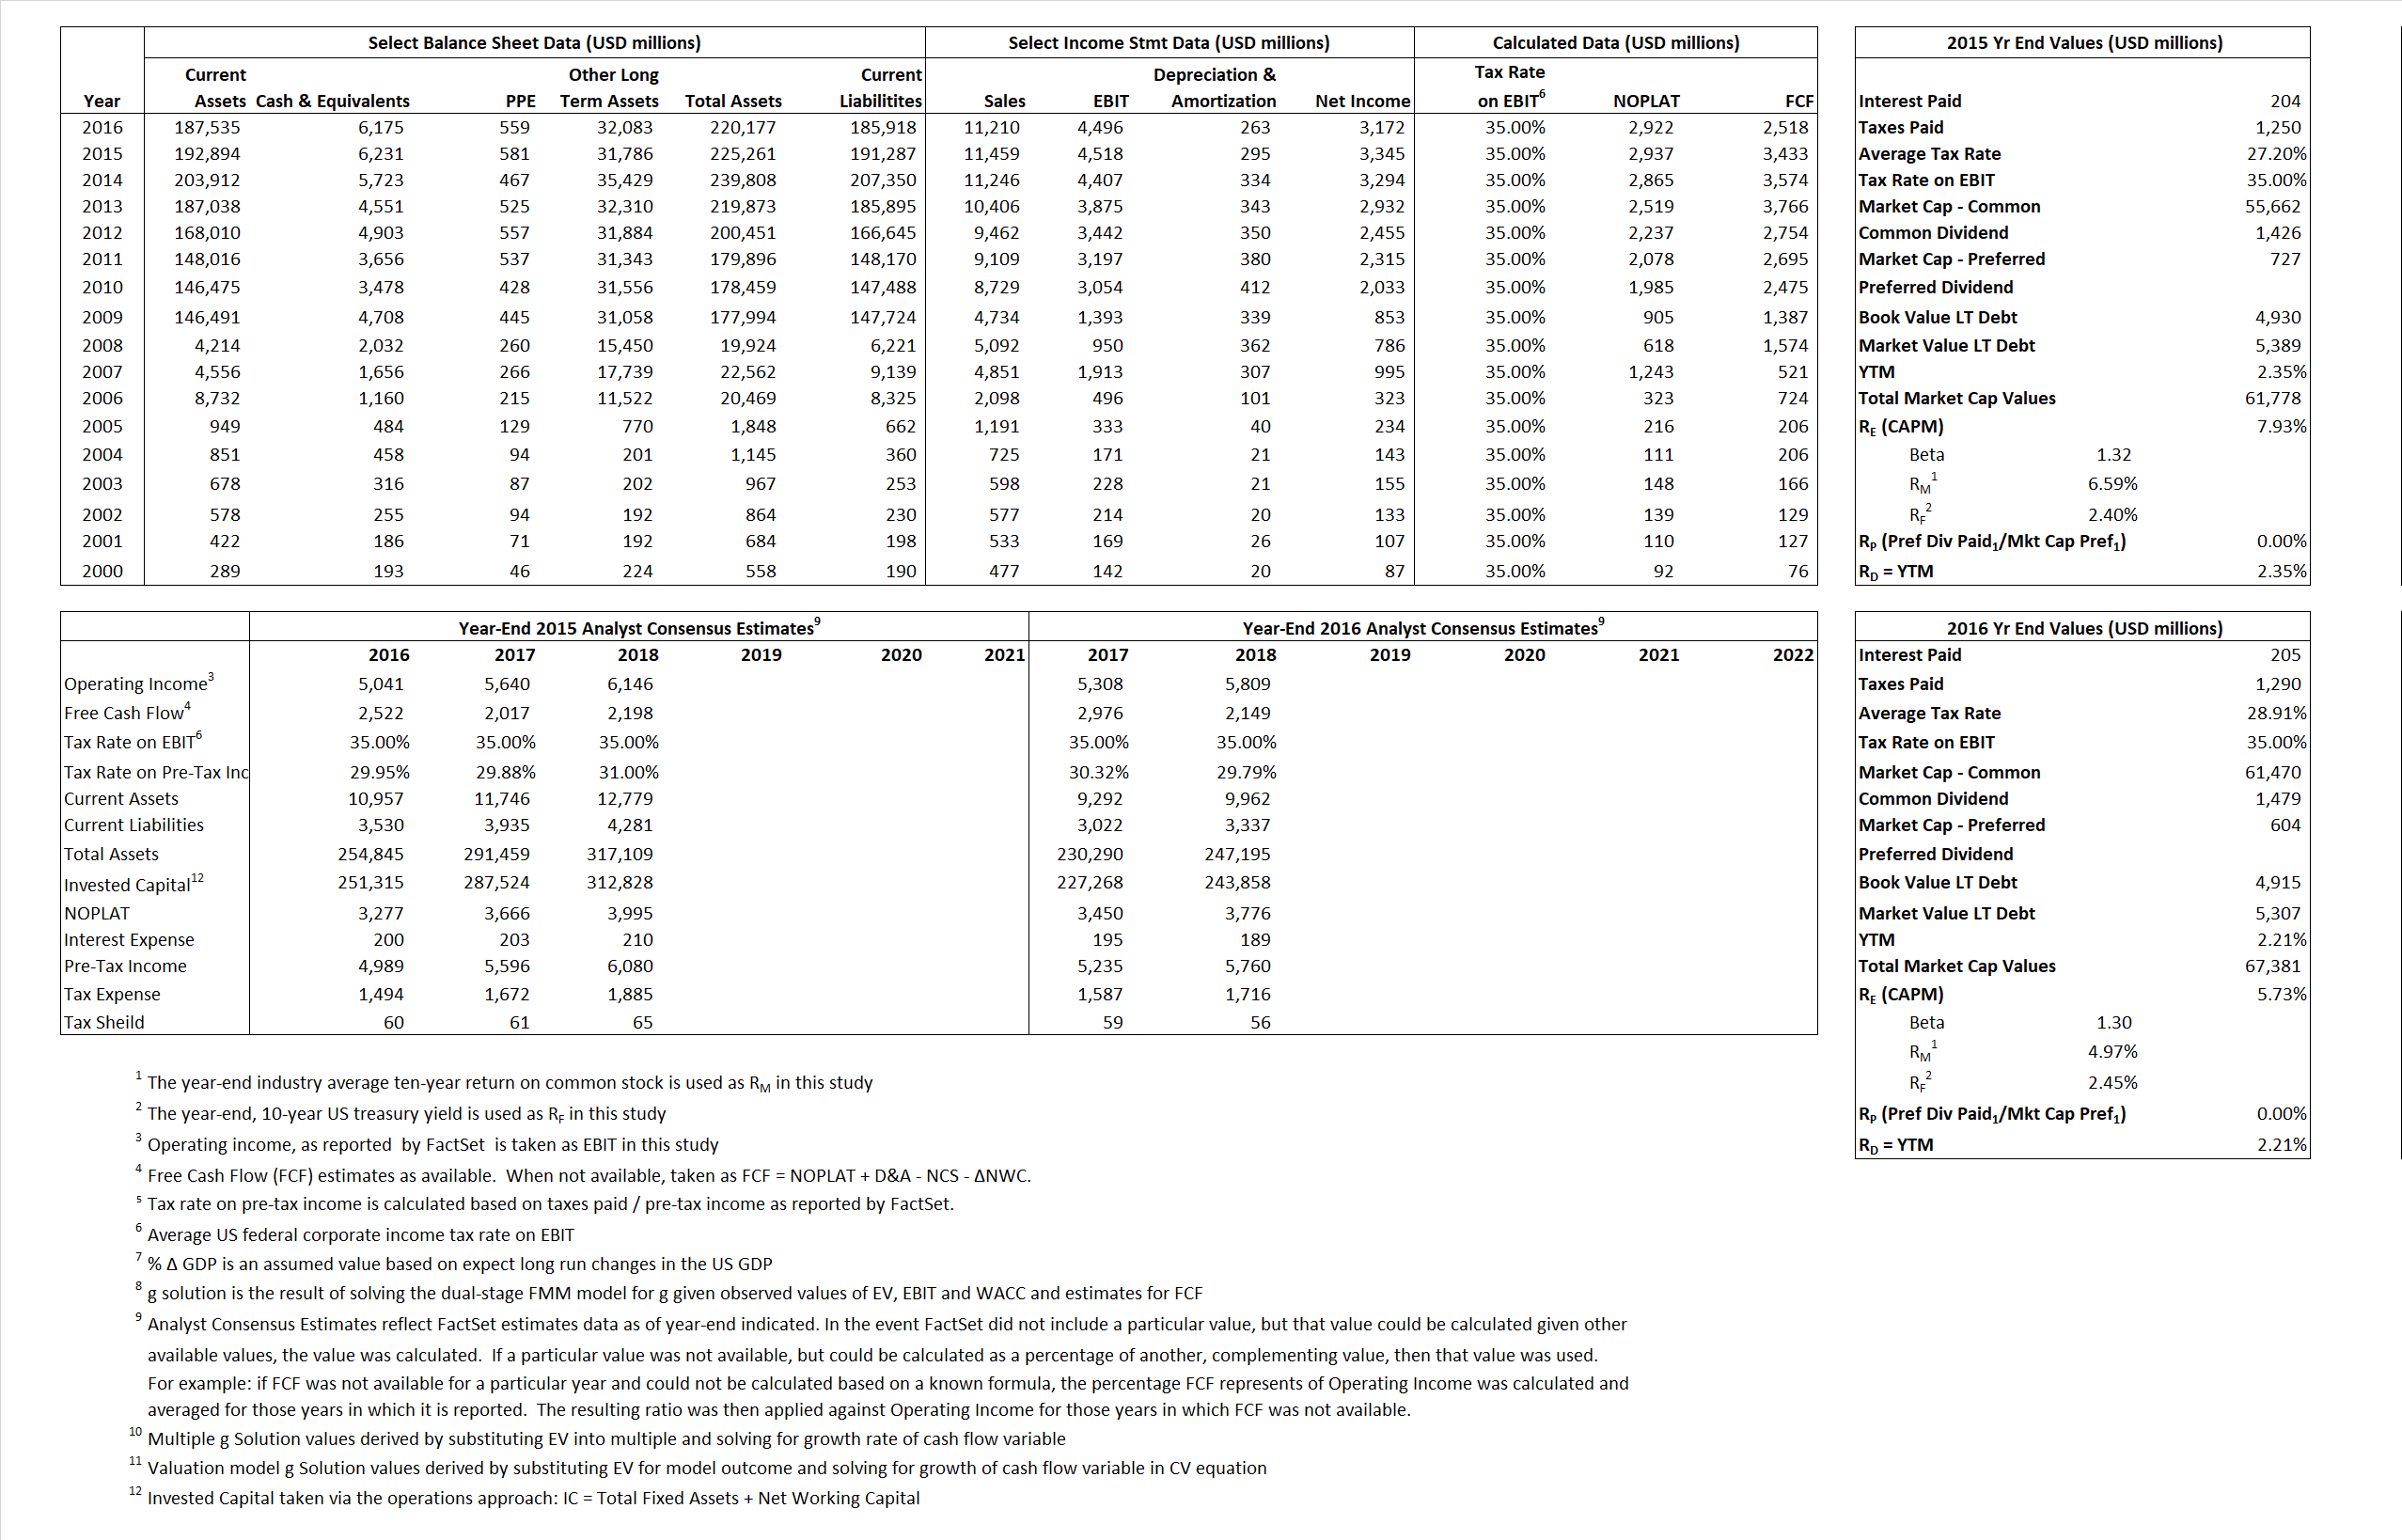
Primary Input Data
Derived Input Data
Derived Input |
Label |
2015 Value |
2016
|
Equational Form |
| Net Operating Profit Less Adjusted Taxes | NOPLAT | 2,937 | 2,922 |  |
| Free Cash Flow | FCF | 3,433 | 2,518 |  |
| Tax Shield | TS | 55 | 59 |  |
| Invested Capital | IC | 33,974 | 34,259 |  |
| Return on Invested Capital | ROIC | 8.64% | 8.53% |  |
| Net Investment | NetInv | 1,811 | 548 |  |
| Investment Rate | IR | 61.67% | 18.75% |  |
| Weighted Average Cost of Capital |
WACCMarket | 7.29% | 5.35% |  |
| WACCBook | 10.93% | 10.27% | ||
| Enterprise value |
EVMarket | 55,547 | 61,206 |  |
| EVBook | 55,088 | 60,814 | ||
| Long-Run Growth |
g = IR x ROIC |
5.33% | 1.60% | Long-run growth rates of the income variable are used in the Continuing Value portion of the valuation models. |
g = %  GDP GDP |
2.50% | 2.50% | ||
| Margin from Operations | M | 39.43% | 40.11% |  |
| Depreciation/Amortization Rate | D | 6.13% | 5.53% |  |
Valuation Multiple Outcomes
The outcomes presented in this study are the result of original input data, derived data, and synthesized inputs.
Equational Form |
Observed Value |
Single-stagemultiple g solution |
Two-stage valuationmodel g solution |
|||
| 12/31/2015 | 12/31/2016 | 12/31/2015 | 12/31/2016 | 12/31/2015 | 12/31/2016 | |
|
|
4.85 |
5.46 |
5.17% | 1.30% | 5.62% | 2.11% |
|
|
11.54 | 12.86 | 5.17% | 1.30% | 5.62% | 2.11% |
|
|
18.91 | 20.94 | 5.17% | 1.30% | 5.62% | 2.11% |
|
|
16.18 | 24.31 | 5.17% | 1.30% | 5.62% | 2.11% |
|
|
12.29 | 13.61 | 5.17% | 1.30% | 5.62% | 2.11% |
|
|
1.63 | 1.79 | 5.17% | 1.30% | 5.62% | 2.11% |


