Mondolez
Analyst Listing
The following analysts provide coverage for the subject firm as of May 2016:
| Broker | Analyst | Analyst Email |
| Bernstein Research | Alexia Howard | alexia.howard@bernstein.com |
| Stifel Nicolaus | Christopher R. Growe | growec@stifel.com |
| RBC Capital Markets | David Palmer | david.palmer@rbccm.com |
| Deutsche Bank Research | Eric Katzman | eric.katzman@db.com |
| Buckingham Research | Eric Larson | elarson@buckresearch.com |
| Wells Fargo Securities | John J. Baumgartner | john.baumgartner@wellsfargo.com |
| Athlos Research | Jonathan P. Feeney | jonathan@athlosresearch.com |
| First Global Stockbroking | Kavita Thomas | kavita.thomas@fglobal.com |
| BMO Capital Markets | Kenneth B. Zaslow | kenneth.zaslow@bmo.com |
| Susquehanna Financial Group | Pablo Zuanic | pablo.zuanic@sig.com |
| Credit Suisse | Robert Moskow | robert.moskow@credit-suisse.com |
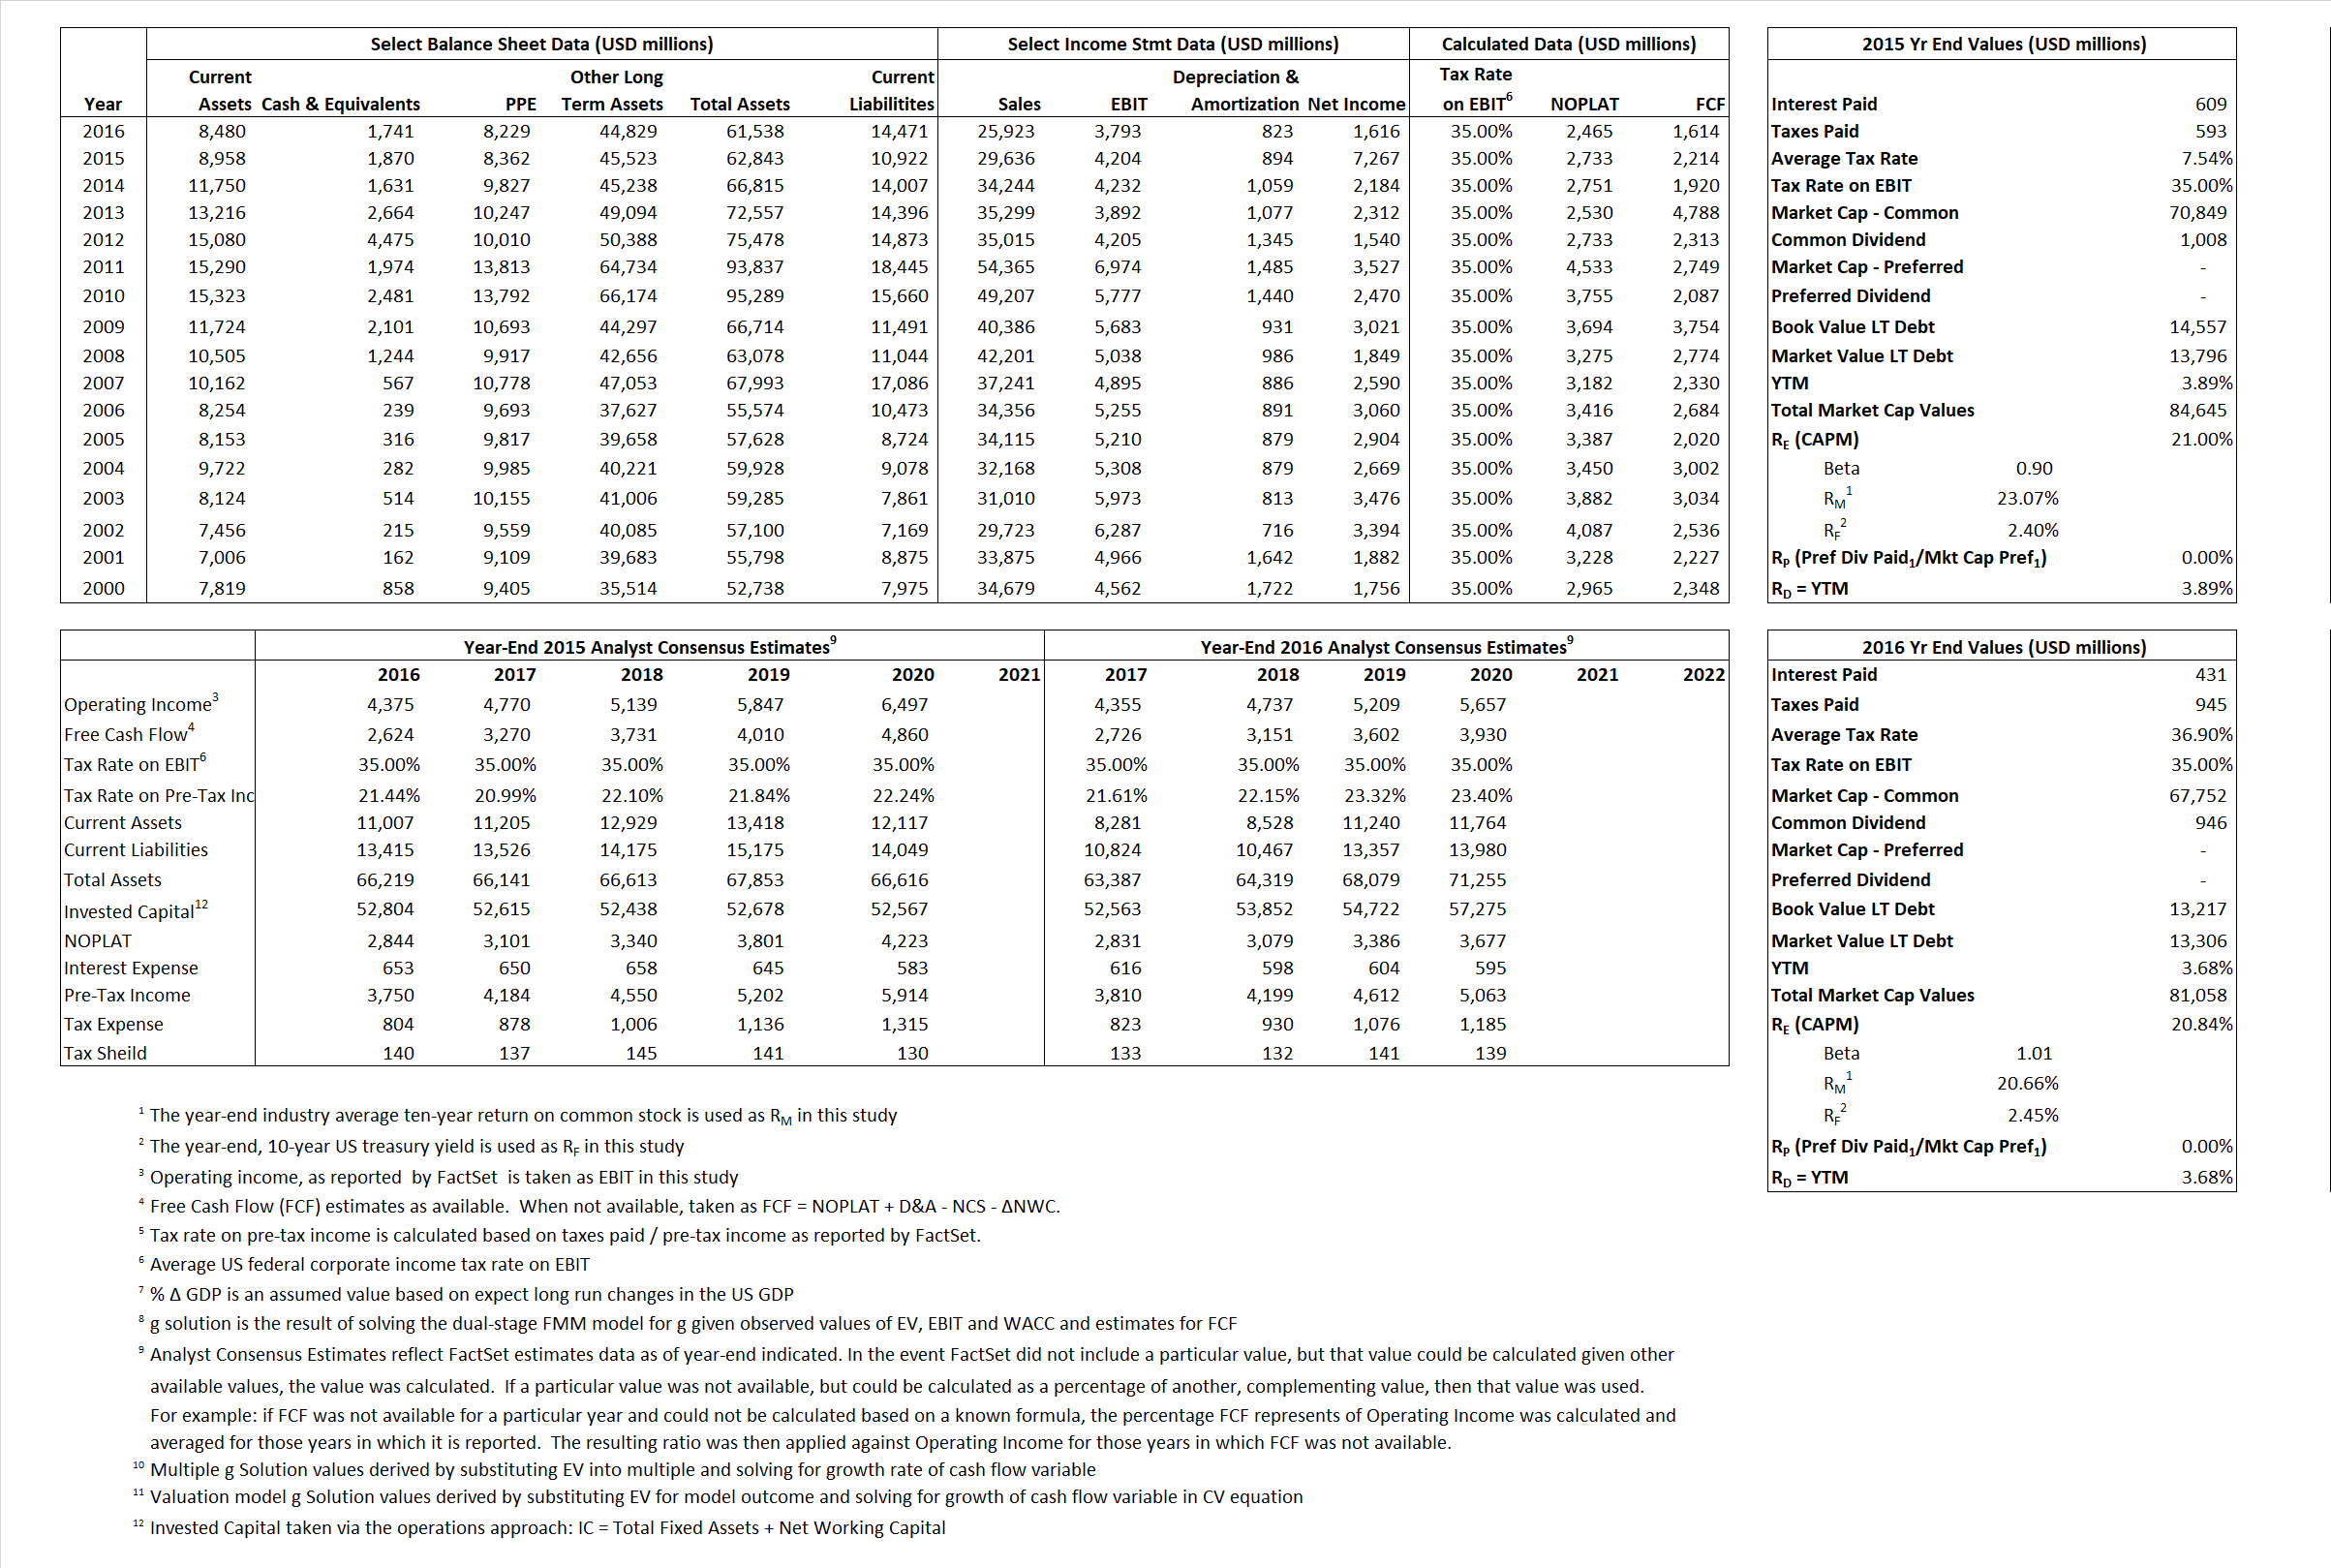
Primary Input Data
Derived Input Data
Derived Input |
Label |
2015 Value |
2016
|
Equational Form |
| Net Operating Profit Less Adjusted Taxes | NOPLAT | 2,733 | 2,465 |  |
| Free Cash Flow | FCF | 2,214 | 1,614 |  |
| Tax Shield | TS | 46 | 159 |  |
| Invested Capital | IC | 51,921 | 47,067 |  |
| Return on Invested Capital | ROIC | 5.26% | 5.24% |  |
| Net Investment | NetInv | 7 | (4,031) |  |
| Investment Rate | IR | 0.26% | -163.50% |  |
| Weighted Average Cost of Capital |
WACCMarket | 18.17% | 17.80% |  |
| WACCBook | 7.68% | 7.76% | ||
| Enterprise value |
EVMarket | 82,775 | 79,317 |  |
| EVBook | 83,665 | 79,228 | ||
| Long-Run Growth |
g = IR x ROIC |
0.01% | -8.56% | Long-run growth rates of the income variable are used in the Continuing Value portion of the valuation models. |
g = %  GDP GDP |
2.50% | 2.50% | ||
| Margin from Operations | M | 14.19% | 14.63% |  |
| Depreciation/Amortization Rate | D | 17.54% | 17.83% |  |
Valuation Multiple Outcomes
The outcomes presented in this study are the result of original input data, derived data, and synthesized inputs.
Equational Form |
Observed Value |
Single-stagemultiple g solution |
Two-stage valuationmodel g solution |
|||
| 12/31/2015 | 12/31/2016 | 12/31/2015 | 12/31/2016 | 12/31/2015 | 12/31/2016 | |
|
|
2.79 | 3.06 | 39.88% | 36.14% | 24.07% | 23.40% |
|
|
16.24 | 17.18 | 39.88% | 36.14% | 24.07% | 23.40% |
|
|
30.29 | 32.17 | 39.88% | 36.14% | 24.07% | 23.40% |
|
|
37.39 | 49.14 | 39.88% | 36.14% | 24.07% | 23.40% |
|
|
19.69 | 20.91 | 39.88% | 36.14% | 24.07% | 23.40% |
|
|
1.59 | 1.69 | 39.88% | 36.14% | 24.07% | 23.40% |


