Southern Company
Analyst Listing
The following analysts provide coverage for the subject firm as of May 2016:
| Broker | Analyst | Analyst Email |
| SunTrust Robinson Humphrey | Ali Agha | ali.agha@suntrust.com |
| Jefferies | Anthony C. Crowdell | acrowdell@jefferies.com |
| Mizuho Securities USA | James Von Riesemann | james.vonriesemann@us.mizuho-sc.com |
| Wells Fargo Securities | Neil Kalton | neil.kalton@wellsfargo.com |
| Guggenheim Securities | Shahriar Pourreza | shahriar.pourreza@guggenheimpartners.com |
| SunTrust Robinson Humphrey | Ali Agha | ali.agha@suntrust.com |
Primary Input Data
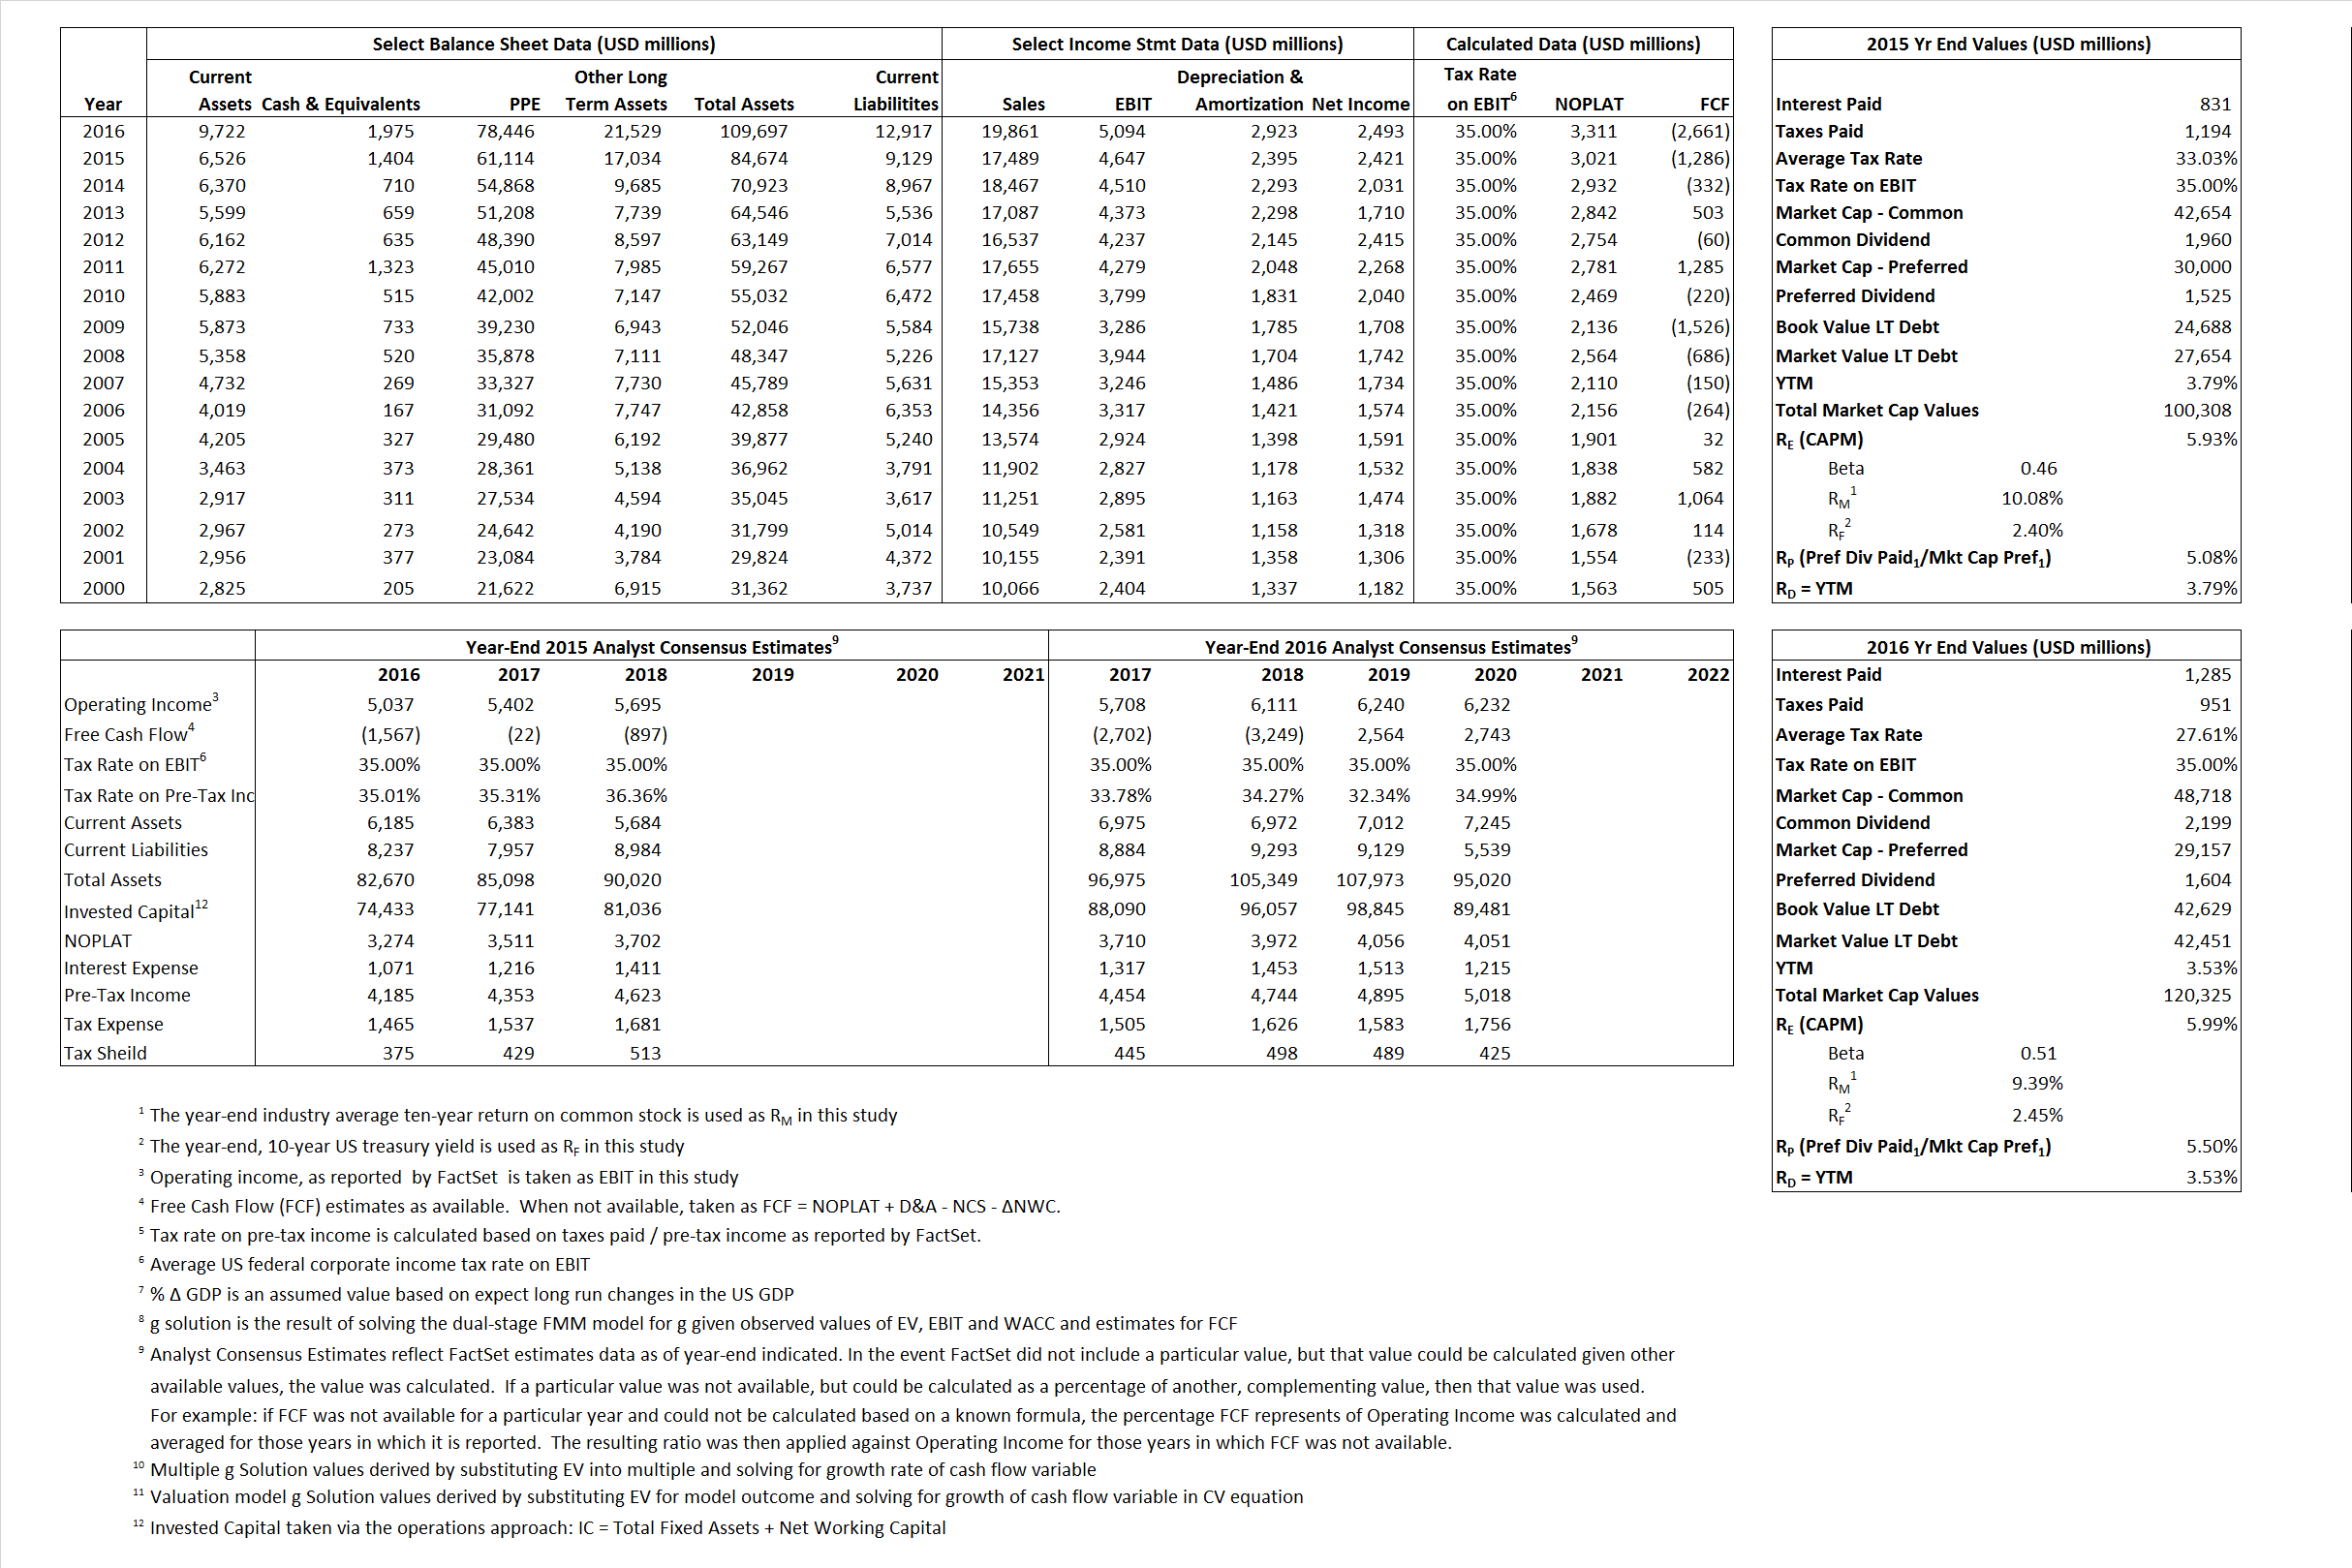
Derived Input Data
Derived Input |
Label |
2015 Value |
2016
|
Equational Form |
| Net Operating Profit Less Adjusted Taxes | NOPLAT | 3,021 | 3,311 |  |
| Free Cash Flow | FCF | (1,286) | (2,661) |  |
| Tax Shield | TS | 274 | 355 |  |
| Invested Capital | IC | 75,545 | 96,780 |  |
| Return on Invested Capital | ROIC | 4.00% | 3.42% |  |
| Net Investment | NetInv | 15,984 | 24,158 |  |
| Investment Rate | IR | 529.18% | 729.61% |  |
| Weighted Average Cost of Capital |
WACCMarket | 4.74% | 4.66% |  |
| WACCBook | 4.09% | 4.04% | ||
| Enterprise value |
EVMarket | 98,904 | 118,350 |  |
| EVBook | 95,367 | 118,528 | ||
| Long-Run Growth |
g = IR x ROIC |
21.16% | 24.96% | Long-run growth rates of the income variable are used in the Continuing Value portion of the valuation models. |
g = %  GDP GDP |
2.50% | 2.50% | ||
| Margin from Operations | M | 26.57% | 25.65% |  |
| Depreciation/Amortization Rate | D | 34.01% | 36.46% |  |
Valuation Multiple Outcomes
The outcomes presented in this study are the result of original input data, derived data, and synthesized inputs.
Equational Form |
Observed Value |
Single-stagemultiple g solution |
Two-stage valuationmodel g solution |
|||
| 12/31/2015 | 12/31/2016 | 12/31/2015 | 12/31/2016 | 12/31/2015 | 12/31/2016 | |
|
|
5.66 | 5.96 | 7.15% | 10.21% | 6.12% | 7.31% |
|
|
14.04 | 14.76 | 7.15% | 10.21% | 6.12% | 7.31% |
|
|
32.74 | 35.74 | 7.15% | 10.21% | 6.12% | 7.31% |
|
|
-76.91 | -44.48 | 7.15% | 10.21% | 6.12% | 7.31% |
|
|
21.28 | 23.23 | 7.15% | 10.21% | 6.12% | 7.31% |
|
|
1.31 | 1.22 | 7.15% | 10.21% | 6.12% | 7.31% |


