US Bancorp
Analyst Listings
The following analysts provide coverage for the subject firm as of May 2016:
| Broker | Analyst | Analyst Email |
| Oppenheimer | Ben Chittenden | kusdin@jefferies.com |
| Nomura Research | Bill Carcache | bill.carcache@nomura.com |
| Atlantic Equities | Christopher Wheeler | c.wheeler@atlantic-equities.com |
| Drexel Hamilton | David Hilder | dhilder@drexelhamilton.com |
| Raymond James | David Long | david.j.long@raymondjames.com |
| Susquehanna Financial Group | Jack Micenko | jack.micenko@sig.com |
| Compass Point Research | Jesus Bueno | jbueno@compasspointllc.com |
| Bernstein Research | John E. McDonald | john.mcdonald@bernstein.com |
| Evercore ISI | John Pancari | john.pancari@evercoreisi.com |
| RBC Capital Markets | Jon Arfstrom | jon.arfstrom@rbccm.com |
| Jefferies | Kenneth Usdin | benjamin.chittenden@opco.com |
| Piper Jaffray | Kevin J. Barker | kevin.j.barker@pjc.com |
| Wells Fargo Securities | Matthew H. Burnell | matt.burnell@wellsfargo.com |
| Deutsche Bank Research | Matthew O’Connor | matthew.o-connor@db.com |
| Societe Generale | Murali Gopal | murali.gopal@sgcib.com |
| FBR Capital Markets & Co | Paul J. Miller | pmiller@fbr.com |
| CRT Capital Group | Peter J. Winter | pwinter@sterneageecrt.com |
| Sandler O’Neill & Partners | R. Scott Siefers | ssiefers@sandleroneill.com |
| Credit Suisse | Susan Roth Katzke | susan.katzke@credit-suisse.com |
| Stephens Inc | Terry McEvoy | terry.mcevoy@stephens.com |
Primary Input Data
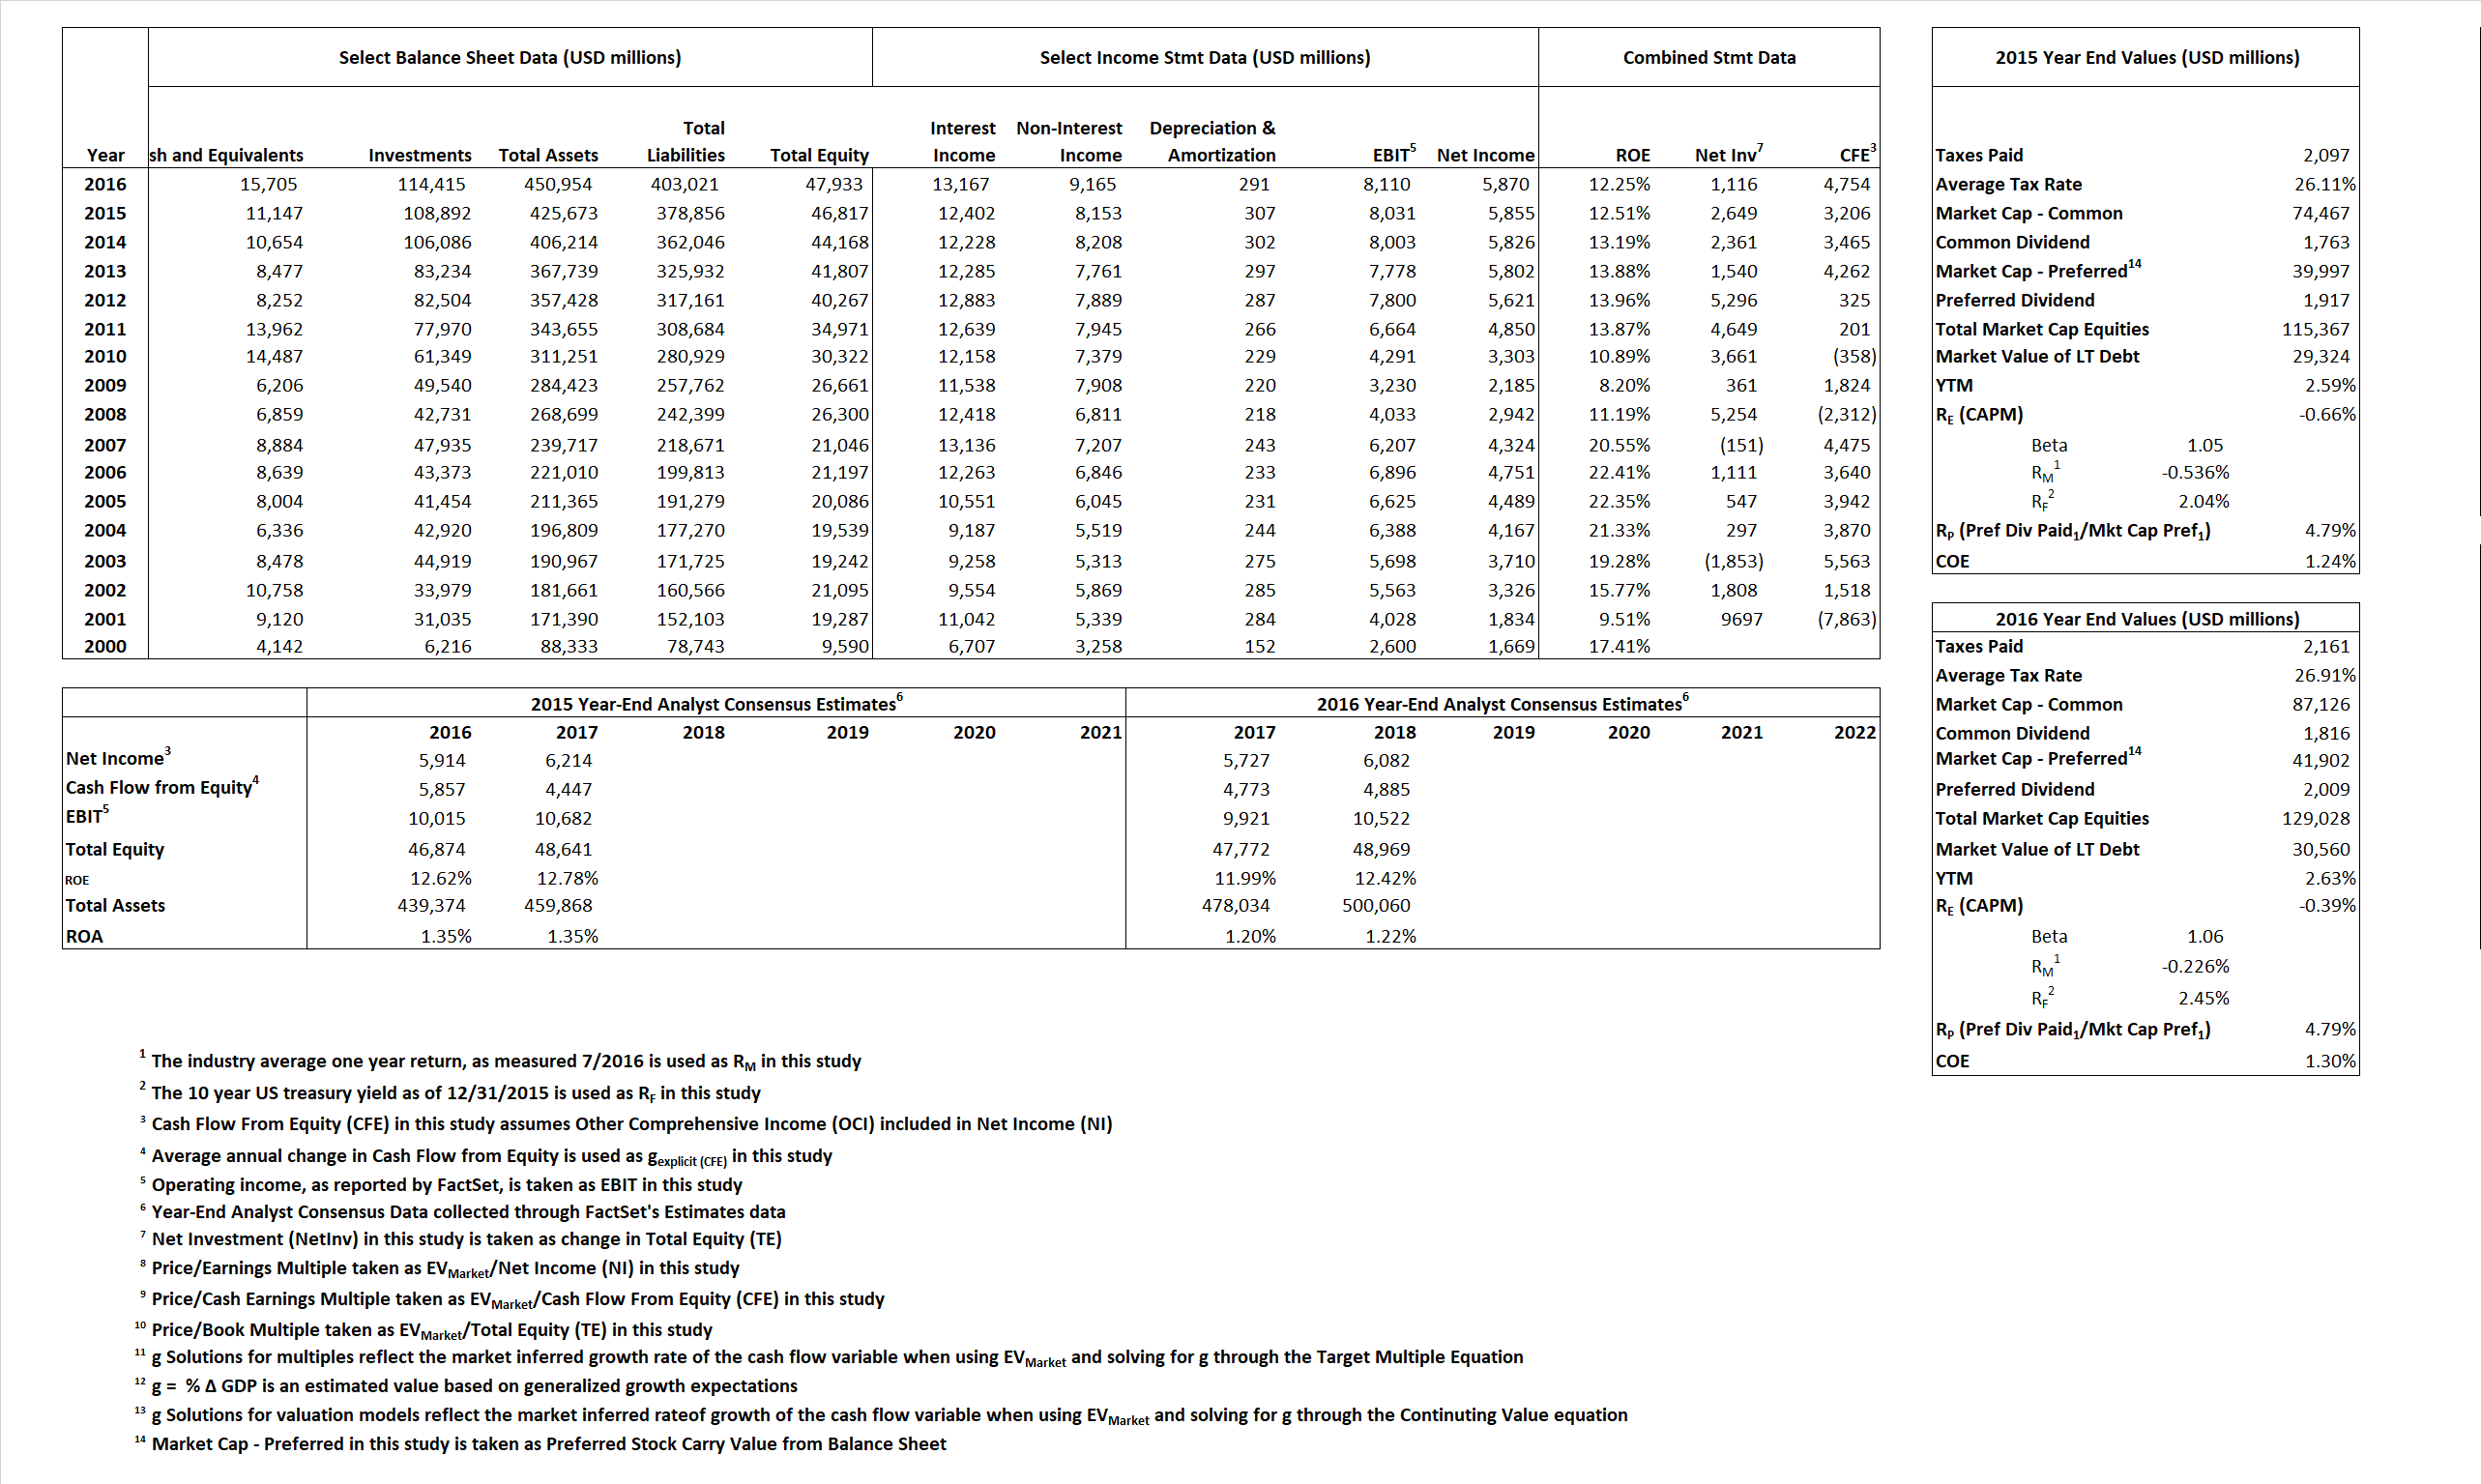
Derived Input Data
| Derived Input | Label |
2015 |
2016 |
Equational Form |
| Net Income | NI | 5,855 | 5,870 |  |
| Cash Flow From Equity | CFE | 3,206 | 4,754 |  |
| Total Equity | TE | 46,817 | 47,933 |  |
| Return on Equity | ROE | 12.51% | 12.25% |  |
| Net Investment | NetInv | 2,649 | 1,116 |  |
| Investment Rate | IR | 45.24% | 19.01% |  |
| Cost of Equity |
COE | -0.66% | -0.39% |  |
| Enterprise value |
EVMarket | 104,220 | 113,323 |  |
| Long-Run Growth |
g = IR x ROIC |
5.66% | 2.33% | Long-run growth rates of the income variable are used in the Continuing Value portion of the valuation models. |
g = %  GDP GDP |
2.50% | 2.50% |
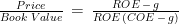
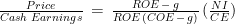
Valuation Multiple Outcomes
The outcomes presented in this study are the result of original input data, derived data, and synthesized inputs.
| Equational Form |
Observed Value |
Single-stage multiple g solution |
Two-stage valuation model g solution |
|||
| 12/31/2015 | 12/31/2016 | 12/31/2015 | 12/31/2016 | 12/31/2015 | 12/31/2016 | |
|
|
||||||
|
|
||||||
|
|
||||||