United Technologies Corporation
Analyst Listing
The following analysts provide coverage for the subject firm as of May 2016:
| Broker | Analyst | Analyst Email |
| Morningstar | Barbara Noverini | barbara.noverini@morningstar.com |
| Langenberg, LLC | Brian K. Langenberg | brian@langenberg-llc.com |
| Cowen & Company | Cai von Rumohr | cai.von-rumohr@cowen.com |
| Bernstein Research | Douglas S. Harned | douglas.harned@bernstein.com |
| Jefferies | Howard A. Rubel | hrubel@jefferies.com |
| Argus Research | John Eade | jeade@argusresearch.com |
| Credit Suisse | Julian Mitchell | julian.mitchell@credit-suisse.com |
| Deutsche Bank Research | Myles Walton | myles.walton@db.com |
| William Blair | Nicholas P. Heymann | nheymann@williamblair.com |
| CRT Capital Group | Peter Arment | parment@sterneageecrt.com |
| Atlantic Equities | Richard Radbourne | r.radbourne@atlantic-equities.com |
| Stifel Nicolaus | Robert P. McCarthy | mccarthyr@stifel.com |
| RBC Capital Markets | Robert Stallard | robert.stallard@rbccm.com |
| Wells Fargo Securities | Sam J. Pearlstein | sam.pearlstein@wellsfargo.com |
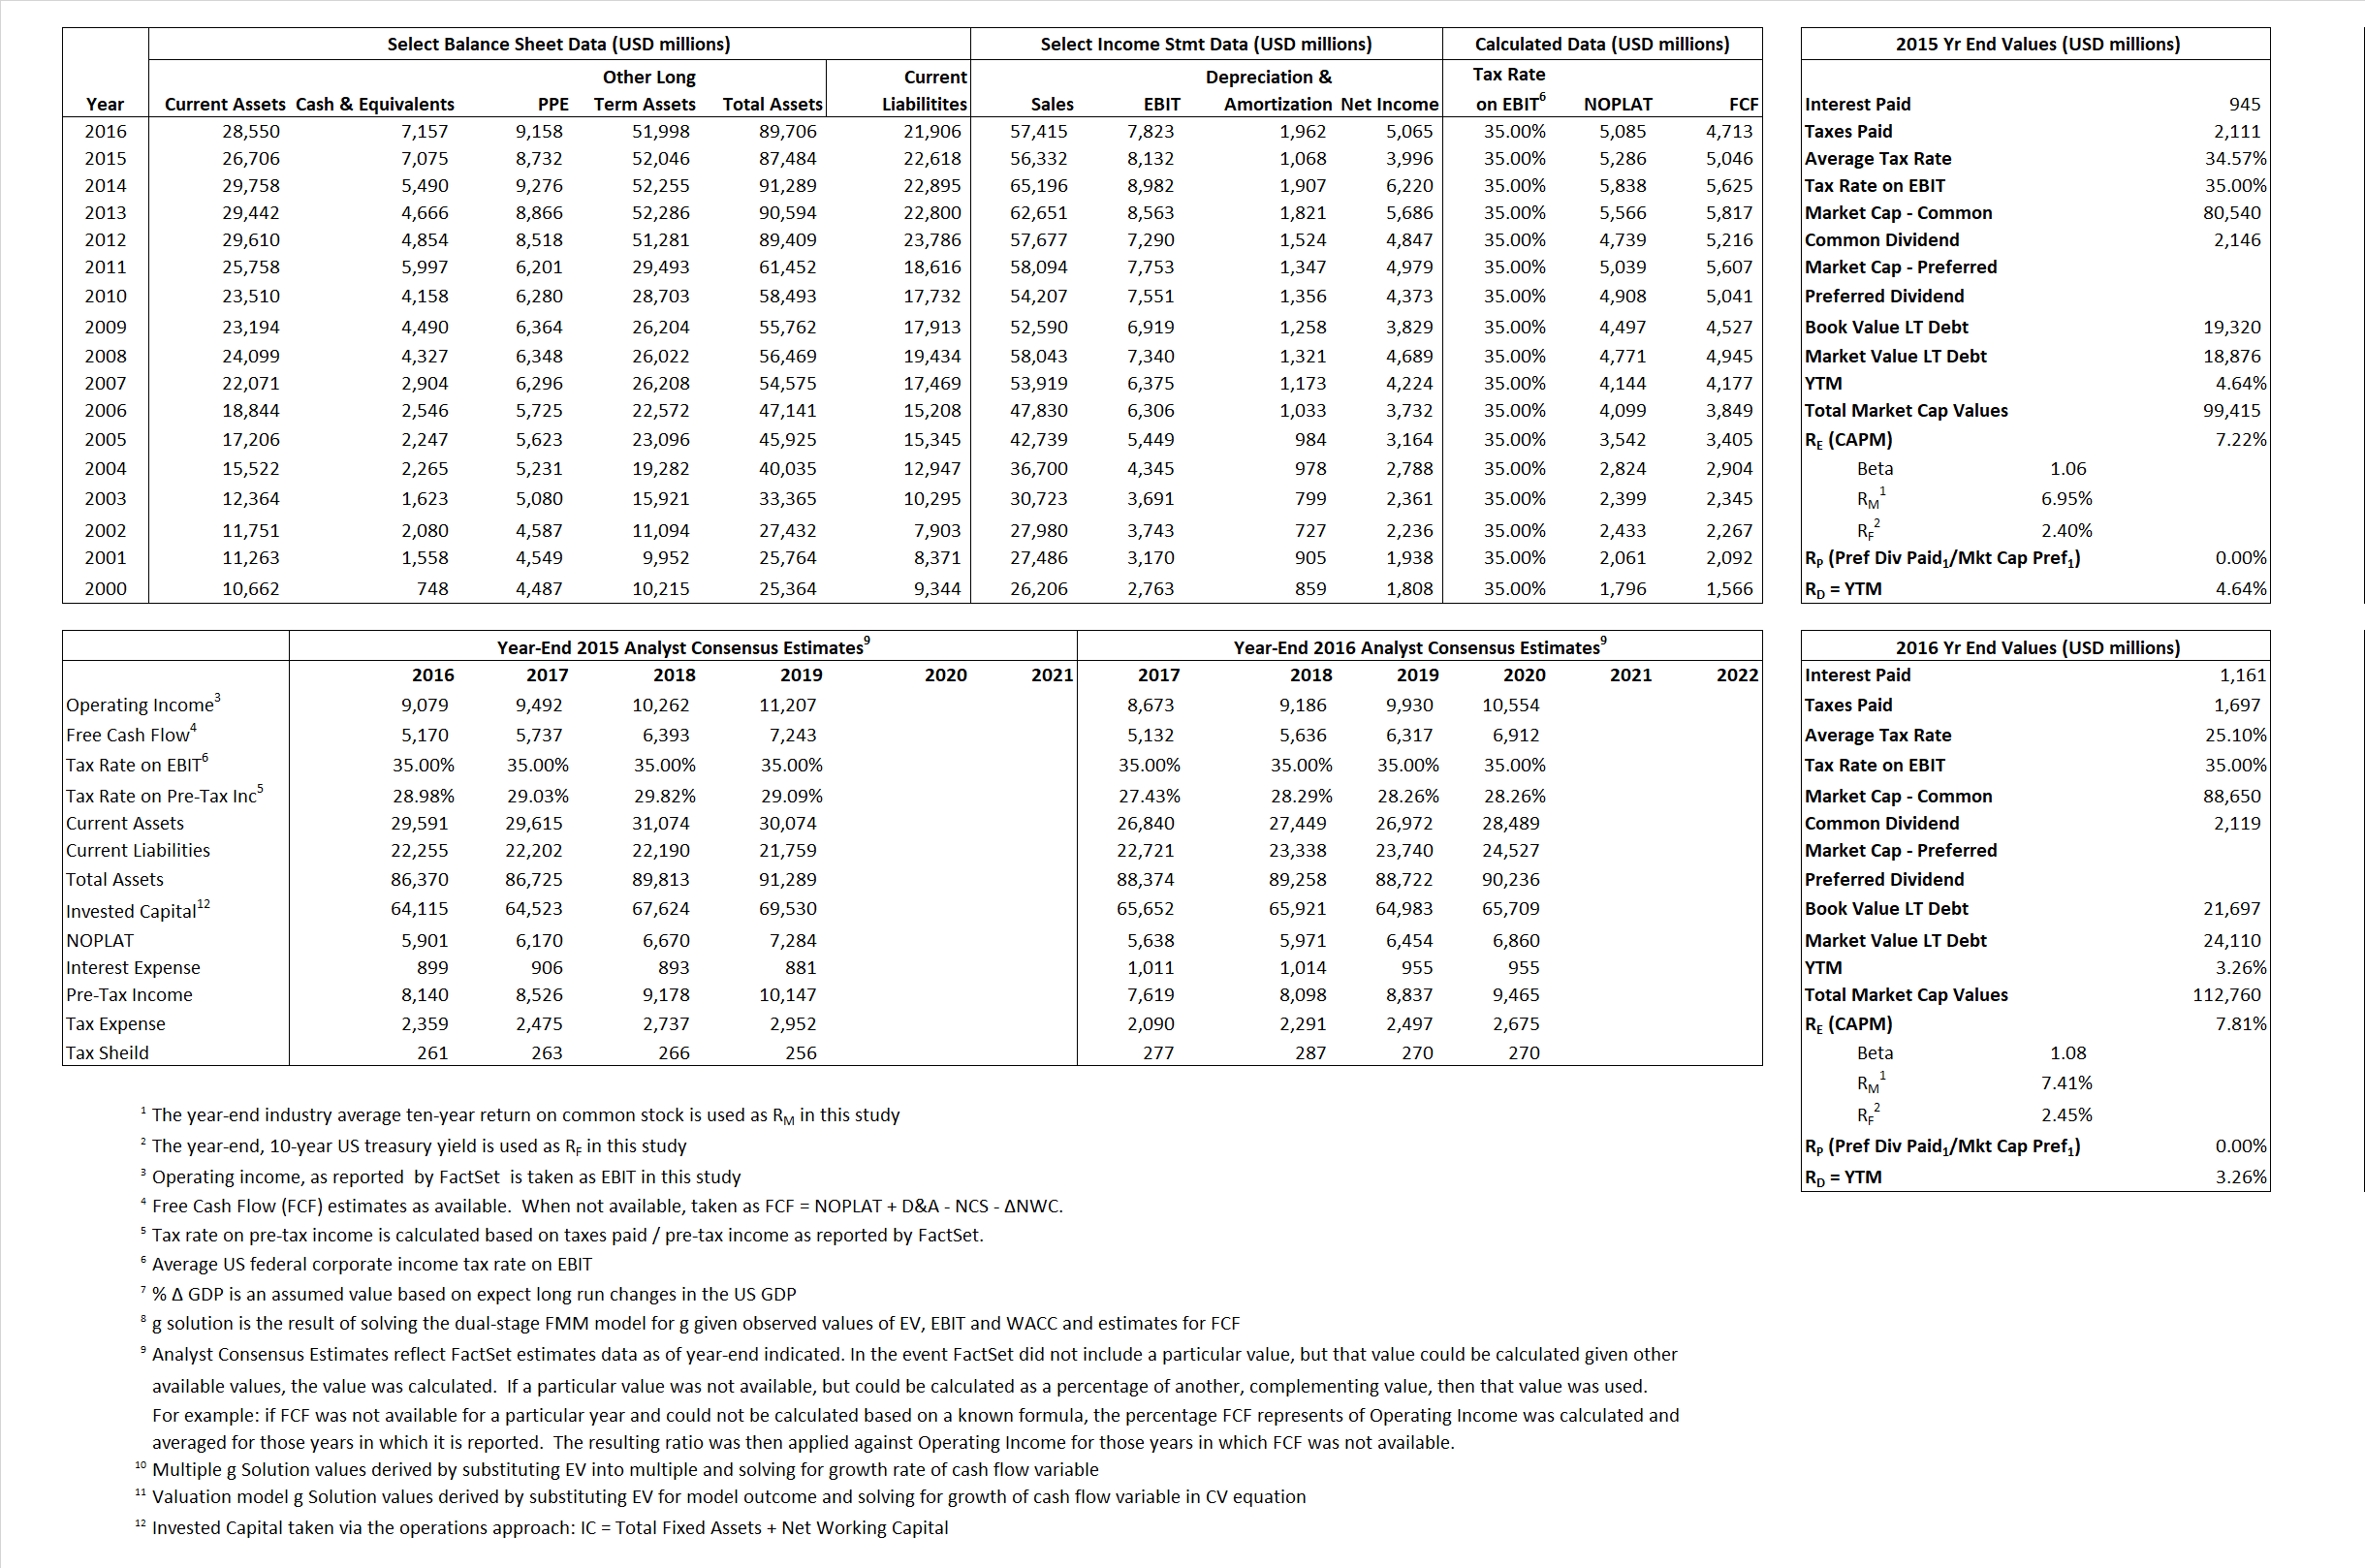
Primary Input Data
Derived Input Data
Derived Input |
Label |
2015 Value |
2016
|
Equational Form |
| Net Operating Profit Less Adjusted Taxes | NOPLAT | 5,286 | 5,085 |  |
| Free Cash Flow | FCF | 5,046 | 4,713 |  |
| Tax Shield | TS | 327 | 291 |  |
| Invested Capital | IC | 64,866 | 67,800 |  |
| Return on Invested Capital | ROIC | 8.15% | 7.50% |  |
| Net Investment | NetInv | (2,460) | 4,896 |  |
| Investment Rate | IR | -46.54% | 96.28% |  |
| Weighted Average Cost of Capital |
WACCMarket | 6.43% | 6.66% |  |
| WACCBook | 8.26% | 7.99% | ||
| Enterprise value |
EVMarket | 92,340 | 105,603 |  |
| EVBook | 92,703 | 103,190 | ||
| Long-Run Growth |
g = IR x ROIC |
-3.79% | 7.22% | Long-run growth rates of the income variable are used in the Continuing Value portion of the valuation models. |
g = %  GDP GDP |
2.50% | 2.50% | ||
| Margin from Operations | M | 14.44% | 13.63% |  |
| Depreciation/Amortization Rate | D | 11.61% | 20.05% |  |
Valuation Multiple Outcomes
The outcomes presented in this study are the result of original input data, derived data, and synthesized inputs.
Equational Form |
Observed Value |
Single-stagemultiple g solution |
Two-stage valuationmodel g solution |
|||
| 12/31/2015 | 12/31/2016 | 12/31/2015 | 12/31/2016 | 12/31/2015 | 12/31/2016 | |
|
|
1.64 | 1.84 | 2.37% | 5.15% | 2.27% | 2.27% |
|
|
10.04 | 10.79 | 2.37% | 5.15% | 2.27% | 2.27% |
|
|
17.47 | 20.77 | 2.37% | 5.15% | 2.27% | 2.27% |
|
|
18.30 | 22.41 | 2.37% | 5.15% | 2.27% | 2.27% |
|
|
11.36 | 13.50 | 2.37% | 5.15% | 2.27% | 2.27% |
|
|
1.42 | 1.56 | 2.37% | 5.15% | 2.27% | 2.27% |


